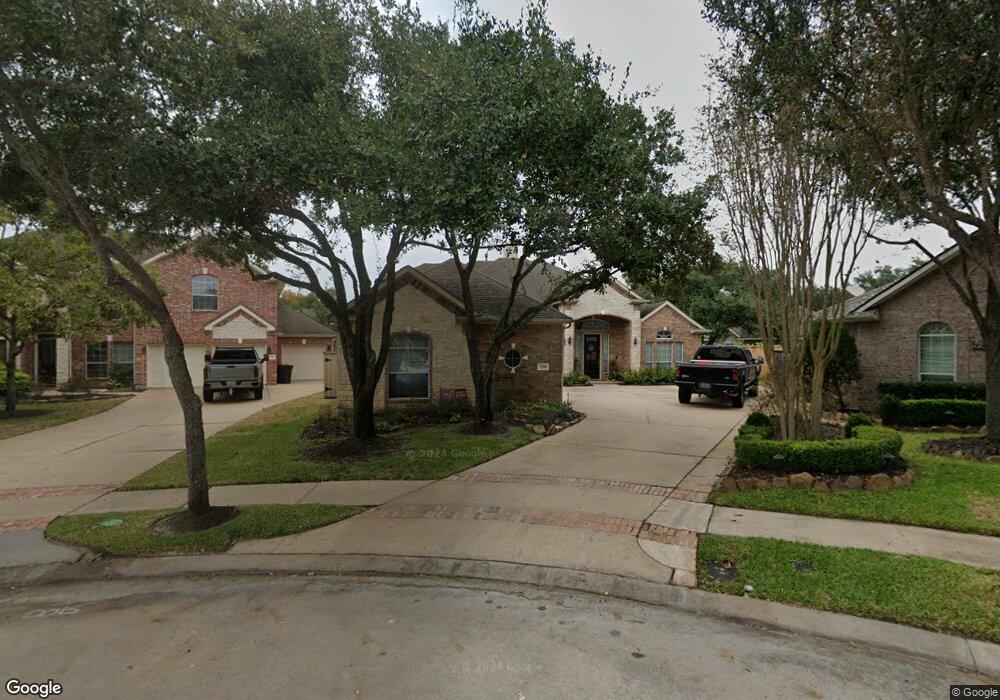
2206 Temecula Cove Katy, TX 77494
Falcon Landing NeighborhoodEstimated Value: $565,000 - $621,000
4
Beds
2
Baths
3,164
Sq Ft
$187/Sq Ft
Est. Value
About This Home
This home is located at 2206 Temecula Cove, Katy, TX 77494 and is currently estimated at $592,509, approximately $187 per square foot. 2206 Temecula Cove is a home located in Fort Bend County with nearby schools including Woodcreek Elementary School, Woodcreek Junior High School, and Obra D. Tompkins High School.
Ownership History
Date
Name
Owned For
Owner Type
Purchase Details
Closed on
Jun 12, 2008
Sold by
Gmac Global Relocation Services Llc
Bought by
Dennis John M and Dennis Cheryl M
Current Estimated Value
Home Financials for this Owner
Home Financials are based on the most recent Mortgage that was taken out on this home.
Original Mortgage
$217,500
Outstanding Balance
$139,783
Interest Rate
6.08%
Mortgage Type
Purchase Money Mortgage
Estimated Equity
$452,726
Purchase Details
Closed on
Nov 24, 2003
Sold by
First Texas Homes Inc
Bought by
Kaufmann Leo E and Kaufmann Stacia N
Home Financials for this Owner
Home Financials are based on the most recent Mortgage that was taken out on this home.
Original Mortgage
$169,053
Interest Rate
6.06%
Mortgage Type
Purchase Money Mortgage
Create a Home Valuation Report for This Property
The Home Valuation Report is an in-depth analysis detailing your home's value as well as a comparison with similar homes in the area
Home Values in the Area
Average Home Value in this Area
Purchase History
| Date | Buyer | Sale Price | Title Company |
|---|---|---|---|
| Dennis John M | -- | First American Title | |
| Dennis John M | -- | -- | |
| Gmac Global Relocation Services Llc | -- | First American Title | |
| Dennis John M | -- | -- | |
| Kaufmann Leo E | -- | Ticor Title Services | |
| Dennis John M | -- | -- |
Source: Public Records
Mortgage History
| Date | Status | Borrower | Loan Amount |
|---|---|---|---|
| Open | Dennis John M | $217,500 | |
| Previous Owner | Dennis John M | $169,053 |
Source: Public Records
Tax History Compared to Growth
Tax History
| Year | Tax Paid | Tax Assessment Tax Assessment Total Assessment is a certain percentage of the fair market value that is determined by local assessors to be the total taxable value of land and additions on the property. | Land | Improvement |
|---|---|---|---|---|
| 2025 | $8,558 | $551,713 | $98,020 | $490,308 |
| 2024 | $8,558 | $501,557 | -- | $505,305 |
| 2023 | $7,835 | $455,961 | $0 | $515,148 |
| 2022 | $8,562 | $414,510 | $0 | $418,810 |
| 2021 | $9,136 | $376,830 | $75,400 | $301,430 |
| 2020 | $8,468 | $342,570 | $58,300 | $284,270 |
| 2019 | $9,123 | $336,560 | $58,300 | $278,260 |
| 2018 | $8,874 | $327,020 | $58,300 | $268,720 |
| 2017 | $9,346 | $343,790 | $58,300 | $285,490 |
| 2016 | $9,568 | $351,930 | $58,300 | $293,630 |
| 2015 | $6,403 | $341,900 | $58,300 | $283,600 |
| 2014 | $5,990 | $310,820 | $58,300 | $252,520 |
Source: Public Records
Map
Nearby Homes
- 1511 Baldridge Ln
- 1927 Anchor Lake Ln
- 26822 Prairie Ln
- 2127 Linden Rock Dr
- 26459 Morgan Creek Ln
- 27118 Ashford Sky Ln
- 2331 Fern Bend Ln
- 1302 Lake Grayson Dr
- 26515 Ashley Ridge Ln
- 1834 Brooking Hill Ct
- 2834 Hollingsworth Pine Ln
- 1907 Lakeside Crossing
- 1335 Lake Grayson Dr
- 26902 Willow Ln
- 1310 McMurtry Ridge Dr
- 26407 Katy Springs Ln
- 26411 Katy Springs Ln
- 1326 McMurtry Ridge Dr
- 27415 Ashford Sky Ln
- 0157 Jas Conner Avalon at Spring Green Rd
- 2210 Temecula Cove
- 2203 Temecula Cove
- 2111 Ivy Cove
- 2114 Ivy Cove
- 2223 Dorman Ct
- 2107 Ivy Cove
- 2227 Dorman Ct
- 2207 Temecula Cove
- 2219 Dorman Ct
- 2110 Ivy Cove
- 1318 Paralee Dr
- 1214 Longdraw Dr
- 1302 Longdraw Dr
- 2215 Dorman Ct
- 1210 Longdraw Dr
- 2103 Ivy Cove
- 1306 Longdraw Dr
- 2211 Temecula Cove
- 1322 Paralee Dr
- 1206 Longdraw Dr