NOT LISTED FOR SALE

2207 Henlopen Ave Wilmington, DE 19804

Estimated Value: $288,000 - $316,000

3 Beds
1 Bath
1,300 Sq Ft
$234/Sq Ft Est. Value

Last Sold February 19, 2016

Last sale price $159,000 $122 Per Sq Ft

Est. 91% increase in value since last sale

Current estimated payment $1,722/month

About This Home

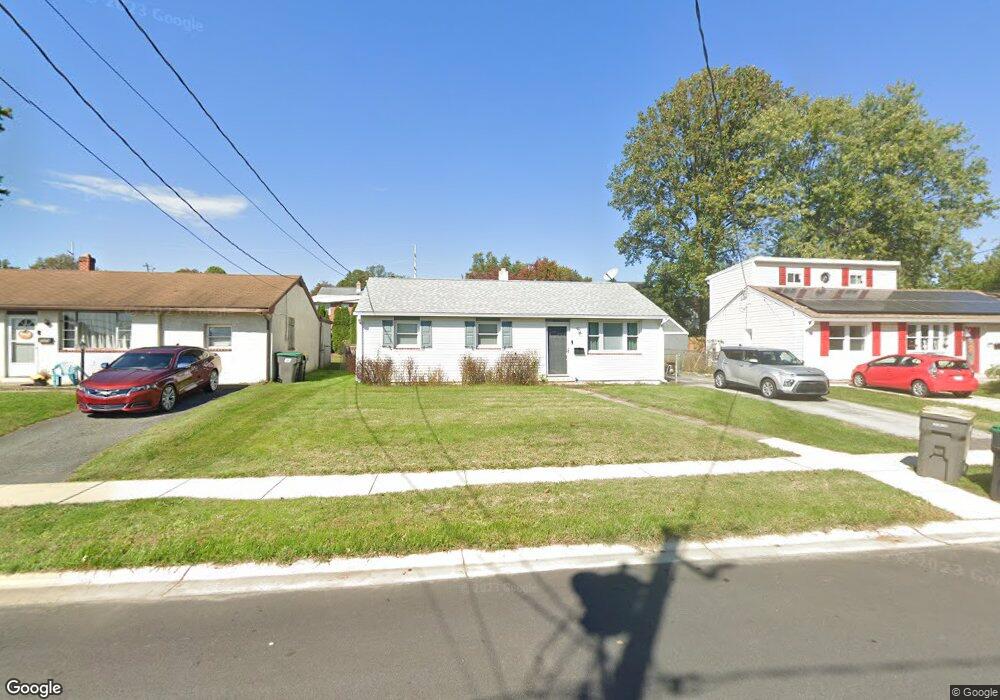
Welcome home to your modern 3 bed, 1 bath ranch w/carport. This home has an open floor plan and lots of windows giving you the feeling of grandeur. The home has an amazing flow. The great room leads to a patio and a fenced in yard. Kitchen and bath are updated, neutral paint, and shows like a model home. A fantastic yard. A must see as you will want to be the new owner.

Ownership History

Date Name Owned For Owner Type

Purchase Details

Listed on
Dec 2, 2015
Closed on
Feb 19, 2016
Sold by
Frazer Richard G
Bought by
Niewinski Dawn M
Seller's Agent
Gina McCollum
RE/MAX Associates-Hockessin
Buyer's Agent
Chuck Hammond
Realty One Group Restore
List Price
$159,000
Sold Price
$159,000
Current Estimated Value
$303,689

Home Financials for this Owner

Home Financials are based on the most recent Mortgage that was taken out on this home.
Estimated Appreciation
$144,689
Avg. Annual Appreciation
6.80%

Purchase Details

Closed on
Apr 29, 2008
Sold by
Davis Martha S and Frazer Gay M
Bought by
Frazer Richard G
Source: Public Records

Range of Values:

--
Value Increase
--
Percent Increase
--
Adjusted for Inflation
Collateral Analytics

Collateral Analytics Collateral Analytics AVMs (Automated Valuation Model) employ a number of statistical approaches combined with neighborhood-specific comparable selection guarantees the most up-to-date and precise valuations.

Not Available

Collateral Analytics does not have data for the current month. Please view the chart for historical values.

ICE

ICE Mortgage Technology ICE Mortgage Technology’s AVM (Automated Valuation Model) is a state-of-the-art online residential property valuation tool that provides a quick and accurate estimate of the value of almost any home in the U.S.

Not Available

ICE Mortgage Technology does not have data for the current month. Please view the chart for historical values.

First American

First American First American Data & Analytics’ next-generation AVM combines unrivaled data assets with a blended ensemble of valuation models to produce highly accurate, reliable valuations you can trust.

Not Available

First American does not have data for the current month. Please view the chart for historical values.

Quantarium

Quantarium Quantarium’s valuation service, repeatedly proven the industry’s most accurate and comprehensive, is supercharged with a self-learning and auto-tuning AI engine that continually becomes smarter and more accurate as it processes daily inputs from the industry’s leading RE data lake.

Not Available

Quantarium does not have data for the current month. Please view the chart for historical values.

Average Value
Not Available
List Price
Sold Price
Create a Home Valuation Report for This Property
The Home Valuation Report is an in-depth analysis detailing your home's value as well as a comparison with similar homes in the area

Home Values in the Area

Source: Public Records

Average Home Value in this Area


Source: Public Records

Purchase History

Date Buyer Sale Price Title Company
Niewinski Dawn M $159,000 Attorney
Frazer Richard G $139,500 None Available
Source: Public Records

Property History

Date Event Price List to Sale Price per Sq Ft Prior Sale
02/19/2016 02/19/16 Sold $159,000 0.0% $122 / Sq Ft View Prior Sale
01/12/2016 01/12/16 Pending -- -- --
12/02/2015 12/02/15 For Sale $159,000 -- $122 / Sq Ft

Tax History Compared to Growth

Source: Public Records

Tax History

Year Tax Paid Tax Assessment Tax Assessment Total Assessment is a certain percentage of the fair market value that is determined by local assessors to be the total taxable value of land and additions on the property. Land Improvement
2024 $1,476 $38,900 $9,100 $29,800
2023 $1,306 $38,900 $9,100 $29,800
2022 $1,315 $38,900 $9,100 $29,800
2021 $1,314 $38,900 $9,100 $29,800
2020 $1,317 $38,900 $9,100 $29,800
2019 $1,468 $38,900 $9,100 $29,800
2018 $1,290 $38,900 $9,100 $29,800
2017 $1,275 $38,900 $9,100 $29,800
2016 $1,217 $38,900 $9,100 $29,800
2015 $755 $38,900 $9,100 $29,800
2014 $714 $38,900 $9,100 $29,800
Source: Public Records

Agents Affiliated with this Home

  • Section Image
  • Section Image
See All Agents

Map