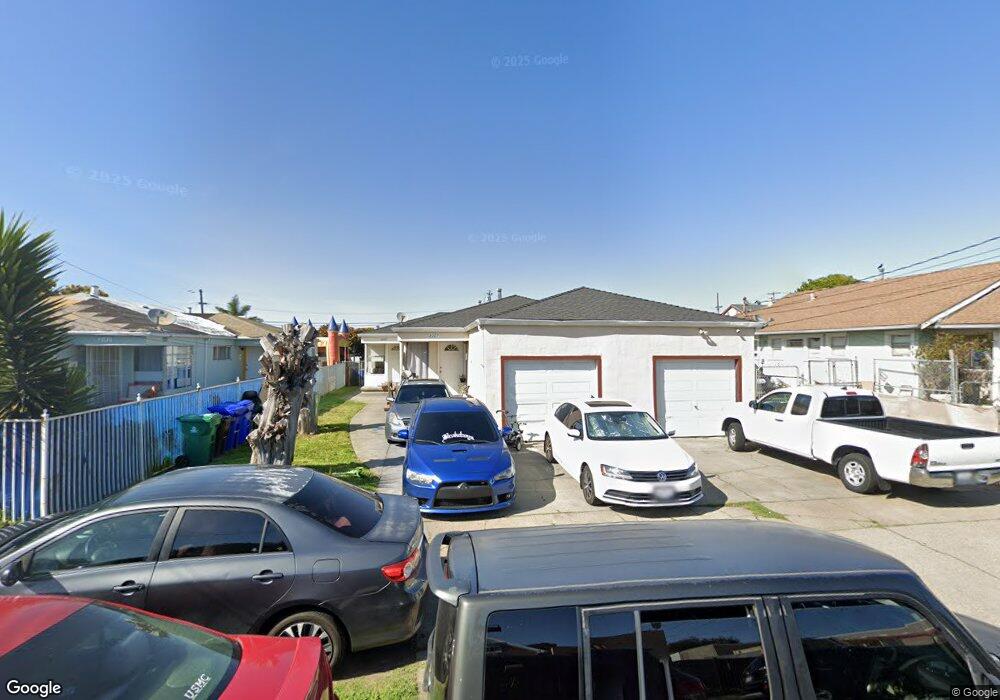
2207 Sanford Ave Unit 2209 San Pablo, CA 94806
Estimated Value: $508,000 - $657,000
4
Beds
2
Baths
1,587
Sq Ft
$366/Sq Ft
Est. Value
About This Home
This home is located at 2207 Sanford Ave Unit 2209, San Pablo, CA 94806 and is currently estimated at $580,836, approximately $365 per square foot. 2207 Sanford Ave Unit 2209 is a home located in Contra Costa County with nearby schools including Edward M. Downer Elementary School, Walter T. Helms Middle School, and Richmond High School.
Ownership History
Date
Name
Owned For
Owner Type
Purchase Details
Closed on
Feb 9, 2001
Sold by
Brehmer Roger and Zeltser Tamara
Bought by
Saldana Roberto
Current Estimated Value
Home Financials for this Owner
Home Financials are based on the most recent Mortgage that was taken out on this home.
Original Mortgage
$228,800
Outstanding Balance
$82,646
Interest Rate
7.08%
Mortgage Type
Purchase Money Mortgage
Estimated Equity
$498,190
Purchase Details
Closed on
Sep 26, 2000
Sold by
Gonzalez Eric E and Samayoa Herman R
Bought by
Brehmer Family Trust
Purchase Details
Closed on
Aug 8, 1996
Sold by
Jackson Cathy M
Bought by
Gonzalez Eric E and Samayoa Herman R
Home Financials for this Owner
Home Financials are based on the most recent Mortgage that was taken out on this home.
Original Mortgage
$115,440
Interest Rate
8.18%
Mortgage Type
FHA
Create a Home Valuation Report for This Property
The Home Valuation Report is an in-depth analysis detailing your home's value as well as a comparison with similar homes in the area
Home Values in the Area
Average Home Value in this Area
Purchase History
| Date | Buyer | Sale Price | Title Company |
|---|---|---|---|
| Saldana Roberto | $286,000 | First American Title Guarant | |
| Saldana Roberto | -- | First American Title Guarant | |
| Brehmer Family Trust | $155,600 | -- | |
| Gonzalez Eric E | $115,500 | Old Republic Title Company |
Source: Public Records
Mortgage History
| Date | Status | Borrower | Loan Amount |
|---|---|---|---|
| Open | Saldana Roberto | $228,800 | |
| Previous Owner | Gonzalez Eric E | $115,440 |
Source: Public Records
Tax History Compared to Growth
Tax History
| Year | Tax Paid | Tax Assessment Tax Assessment Total Assessment is a certain percentage of the fair market value that is determined by local assessors to be the total taxable value of land and additions on the property. | Land | Improvement |
|---|---|---|---|---|
| 2025 | $7,439 | $430,929 | $157,676 | $273,253 |
| 2024 | $7,265 | $422,481 | $154,585 | $267,896 |
| 2023 | $7,265 | $414,198 | $151,554 | $262,644 |
| 2022 | $7,143 | $406,078 | $148,583 | $257,495 |
| 2021 | $7,084 | $398,117 | $145,670 | $252,447 |
| 2019 | $6,706 | $386,310 | $141,350 | $244,960 |
| 2018 | $6,427 | $378,736 | $138,579 | $240,157 |
| 2017 | $6,245 | $371,311 | $135,862 | $235,449 |
| 2016 | $5,696 | $330,000 | $120,700 | $209,300 |
| 2015 | -- | $290,000 | $106,100 | $183,900 |
| 2014 | $4,765 | $255,000 | $93,300 | $161,700 |
Source: Public Records
Map
Nearby Homes
- 2143-2147 Sanford Ave
- 1337 24th St
- 0 California Ave
- 1932 California Ave
- 2110 Hellings Ave
- 1902 Dunn Ave
- 2425 Humphrey Ave
- 1825 California Ave
- 1753 California Ave
- 1921 Coalinga Ave
- 1527 24th St
- 2376 Bush Ave
- 1800 Hellings Ave
- 2420 Bush Ave
- 1741 Hellings Ave
- 2633 Humphrey Ave
- 1929 Lincoln Ave
- 1616 Pine Ave
- 2719 Bush Ave
- 1920 Lincoln Ave
- 2227 Sanford Ave
- 2143 Sanford Ave Unit 2147
- 2139 Sanford Ave
- 2232 Wilcox Ave
- 2234 Wilcox Ave
- 2226 Wilcox Ave
- 1217 23rd St
- 2127 Sanford Ave
- 2136 Wilcox Ave
- 1221 23rd St
- 2200 Sanford Ave
- 2190 Sanford Ave
- 2140 Sanford Ave
- 1229 23rd St Unit 1231
- 1229 23rd St
- 2121 Sanford Ave
- 2124 Wilcox Ave
- 2138 Sanford Ave
- 1181 23rd St
- 2115 Sanford Ave