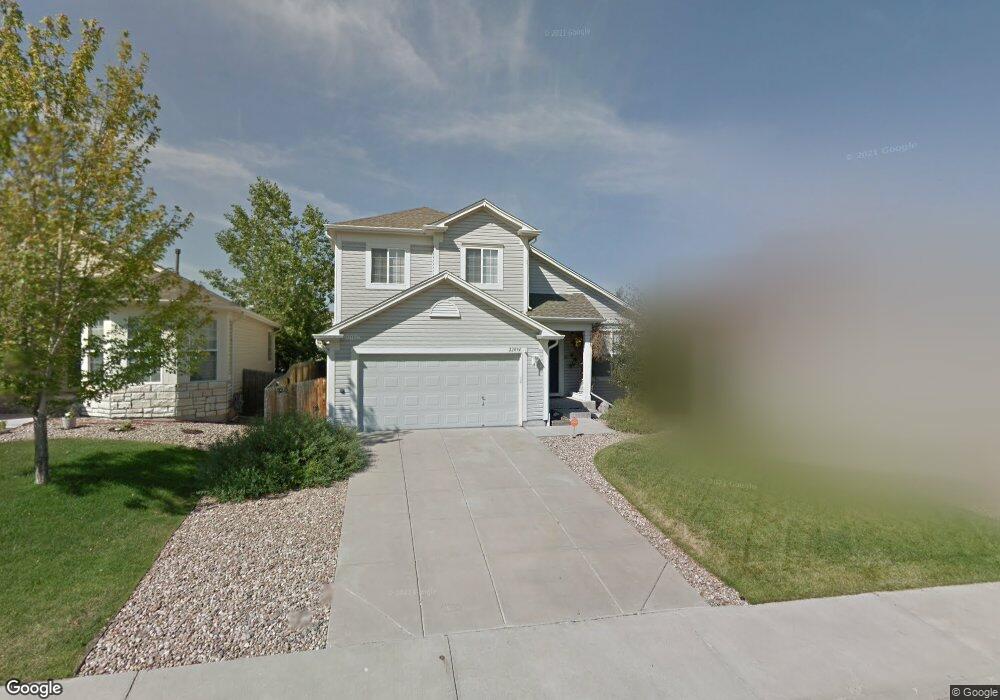
22094 Pensive Ct Parker, CO 80138
Villages of Parker NeighborhoodEstimated Value: $596,000 - $606,000
4
Beds
3
Baths
2,593
Sq Ft
$232/Sq Ft
Est. Value
About This Home
This home is located at 22094 Pensive Ct, Parker, CO 80138 and is currently estimated at $602,450, approximately $232 per square foot. 22094 Pensive Ct is a home located in Douglas County with nearby schools including Frontier Valley Elementary School, Cimarron Middle School, and Legend High School.
Ownership History
Date
Name
Owned For
Owner Type
Purchase Details
Closed on
Dec 12, 2019
Sold by
Zimmer Thomas J
Bought by
Zimmer Thomas Joseph
Current Estimated Value
Purchase Details
Closed on
Apr 11, 2008
Sold by
Prudential Relocation Inc
Bought by
Zimmer Thomas J
Purchase Details
Closed on
Apr 4, 2008
Sold by
Cruzan Robert B and Cruzan Christine R
Bought by
Prudential Relocation Inc
Purchase Details
Closed on
May 26, 2000
Sold by
Pulte Home Corp
Bought by
Cruzan Robert B and Cruzan Christine R
Home Financials for this Owner
Home Financials are based on the most recent Mortgage that was taken out on this home.
Original Mortgage
$203,017
Interest Rate
8.17%
Mortgage Type
FHA
Purchase Details
Closed on
Sep 13, 1999
Sold by
Canterberry Dev Co
Bought by
Pulte Home Corp
Purchase Details
Closed on
Mar 3, 1999
Sold by
Parker Land Assoc
Bought by
Canterberry Dev Co
Create a Home Valuation Report for This Property
The Home Valuation Report is an in-depth analysis detailing your home's value as well as a comparison with similar homes in the area
Home Values in the Area
Average Home Value in this Area
Purchase History
| Date | Buyer | Sale Price | Title Company |
|---|---|---|---|
| Zimmer Thomas Joseph | -- | None Available | |
| Zimmer Thomas J | $251,600 | Chicago Title Co | |
| Prudential Relocation Inc | $251,600 | Chicago Title Co | |
| Prudential Relocation Inc | $251,600 | -- | |
| Cruzan Robert B | $204,656 | Land Title | |
| Pulte Home Corp | $1,584,000 | -- | |
| Canterberry Dev Co | $14,360,900 | -- |
Source: Public Records
Mortgage History
| Date | Status | Borrower | Loan Amount |
|---|---|---|---|
| Previous Owner | Cruzan Robert B | $203,017 |
Source: Public Records
Tax History Compared to Growth
Tax History
| Year | Tax Paid | Tax Assessment Tax Assessment Total Assessment is a certain percentage of the fair market value that is determined by local assessors to be the total taxable value of land and additions on the property. | Land | Improvement |
|---|---|---|---|---|
| 2024 | $4,094 | $43,480 | $9,080 | $34,400 |
| 2023 | $4,135 | $43,480 | $9,080 | $34,400 |
| 2022 | $3,153 | $29,130 | $5,450 | $23,680 |
| 2021 | $3,275 | $29,130 | $5,450 | $23,680 |
| 2020 | $3,226 | $29,240 | $5,710 | $23,530 |
| 2019 | $3,242 | $29,240 | $5,710 | $23,530 |
| 2018 | $3,078 | $25,970 | $5,720 | $20,250 |
| 2017 | $2,907 | $25,970 | $5,720 | $20,250 |
| 2016 | $2,678 | $23,590 | $4,850 | $18,740 |
| 2015 | $1,411 | $23,590 | $4,850 | $18,740 |
| 2014 | $1,272 | $19,520 | $5,490 | $14,030 |
Source: Public Records
Map
Nearby Homes
- 21796 Silver Meadow Ln
- 11333 S Lost Creek Cir
- 22380 Quail Run Dr
- 21589 Omaha Ave
- 22389 Quail Run Dr
- 22695 E River Chase Way
- 21906 Swale Dr
- 22428 Quail Run Ln
- 21822 Longs Peak Ln
- 23014 Milford Ln
- 11048 Tim Tam Way
- 22935 E River Chase Way
- 23080 York Ave
- 21701 Swale Ave
- 22938 Blackwolf Way
- 11465 Canterberry Ln
- 23078 E River Chase Way
- 11042 Blackwolf Ln
- 11584 Pine Canyon Ln
- 23235 E York Ave
- 22096 Pensive Ct
- 22092 Pensive Ct
- 22098 Pensive Ct
- 22090 Pensive Ct
- 22100 Pensive Ct
- 22095 Pensive Ct
- 22102 Pensive Ct
- 22097 Pensive Ct
- 11258 Gallahadion Ln
- 11256 Gallahadion Ln
- 22058 Day Star Dr
- 11260 Gallahadion Ln
- 22101 Pensive Ct
- 11254 Gallahadion Ln
- 22104 Pensive Ct
- 11262 Gallahadion Ln
- 22060 Day Star Dr
- 22131 Wintergreen Way
- 11252 Gallahadion Ln
- 22103 Pensive Ct