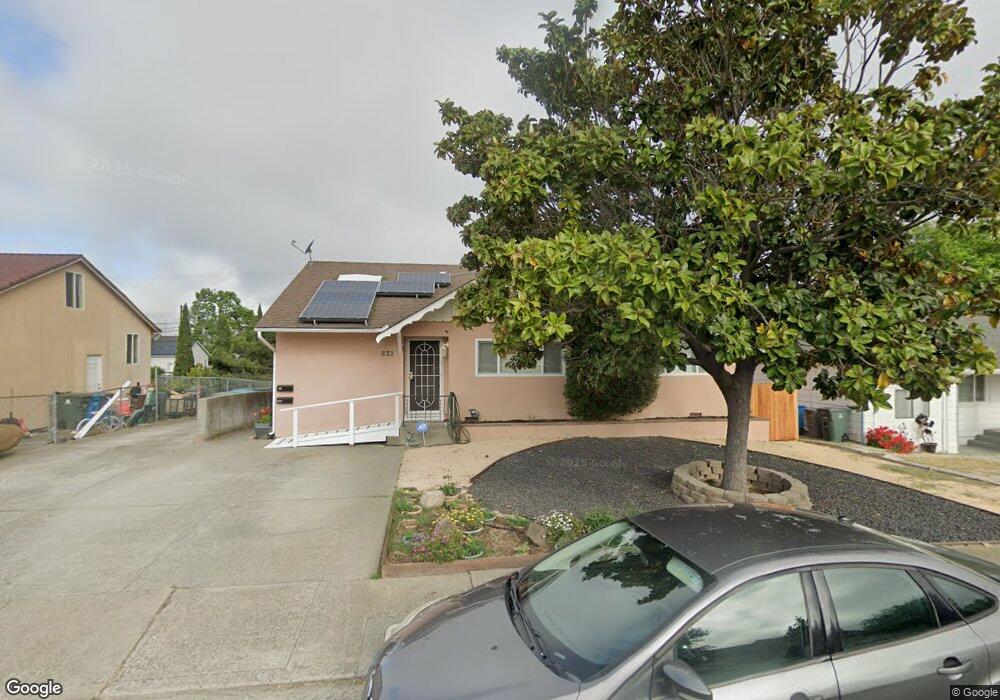
221 Gary Cir Vallejo, CA 94591
South Vallejo NeighborhoodEstimated Value: $388,000 - $436,391
2
Beds
1
Bath
1,029
Sq Ft
$406/Sq Ft
Est. Value
About This Home
This home is located at 221 Gary Cir, Vallejo, CA 94591 and is currently estimated at $417,848, approximately $406 per square foot. 221 Gary Cir is a home located in Solano County with nearby schools including Jesse M. Bethel High School, Mustard Seed Preschool and Kindergarten, and St. Patrick-St. Vincent High School.
Ownership History
Date
Name
Owned For
Owner Type
Purchase Details
Closed on
Jul 30, 2022
Sold by
Nesbit Hardison Andrea
Bought by
Marion And Andrea Hardison Family Trust
Current Estimated Value
Purchase Details
Closed on
May 17, 2014
Sold by
Hardison Marion W
Bought by
Hardison Marion W and Hardison Andrea Nesbit
Purchase Details
Closed on
Aug 12, 2009
Sold by
Hardison Marion W
Bought by
Hardison Mary A and Mary A Hardison Trust
Purchase Details
Closed on
Mar 25, 2003
Sold by
Hardison Mary A
Bought by
Hardison Marion W
Create a Home Valuation Report for This Property
The Home Valuation Report is an in-depth analysis detailing your home's value as well as a comparison with similar homes in the area
Home Values in the Area
Average Home Value in this Area
Purchase History
| Date | Buyer | Sale Price | Title Company |
|---|---|---|---|
| Marion And Andrea Hardison Family Trust | -- | Busch Robert J | |
| Hardison Marion W | -- | None Available | |
| Hardison Mary A | -- | None Available | |
| Hardison Marion W | -- | -- |
Source: Public Records
Tax History
| Year | Tax Paid | Tax Assessment Tax Assessment Total Assessment is a certain percentage of the fair market value that is determined by local assessors to be the total taxable value of land and additions on the property. | Land | Improvement |
|---|---|---|---|---|
| 2025 | $5,625 | $411,998 | $104,040 | $307,958 |
| 2024 | $5,625 | $403,920 | $102,000 | $301,920 |
| 2023 | $1,368 | $41,049 | $10,594 | $30,455 |
| 2022 | $1,250 | $40,245 | $10,388 | $29,857 |
| 2021 | $1,218 | $39,457 | $10,185 | $29,272 |
| 2020 | $1,191 | $39,053 | $10,081 | $28,972 |
| 2019 | $1,123 | $38,288 | $9,884 | $28,404 |
| 2018 | $1,029 | $37,539 | $9,691 | $27,848 |
| 2017 | $952 | $36,803 | $9,501 | $27,302 |
| 2016 | $379 | $36,082 | $9,315 | $26,767 |
| 2015 | $373 | $35,541 | $9,176 | $26,365 |
| 2014 | $447 | $34,846 | $8,997 | $25,849 |
Source: Public Records
Map
Nearby Homes
Your Personal Tour Guide
Ask me questions while you tour the home.