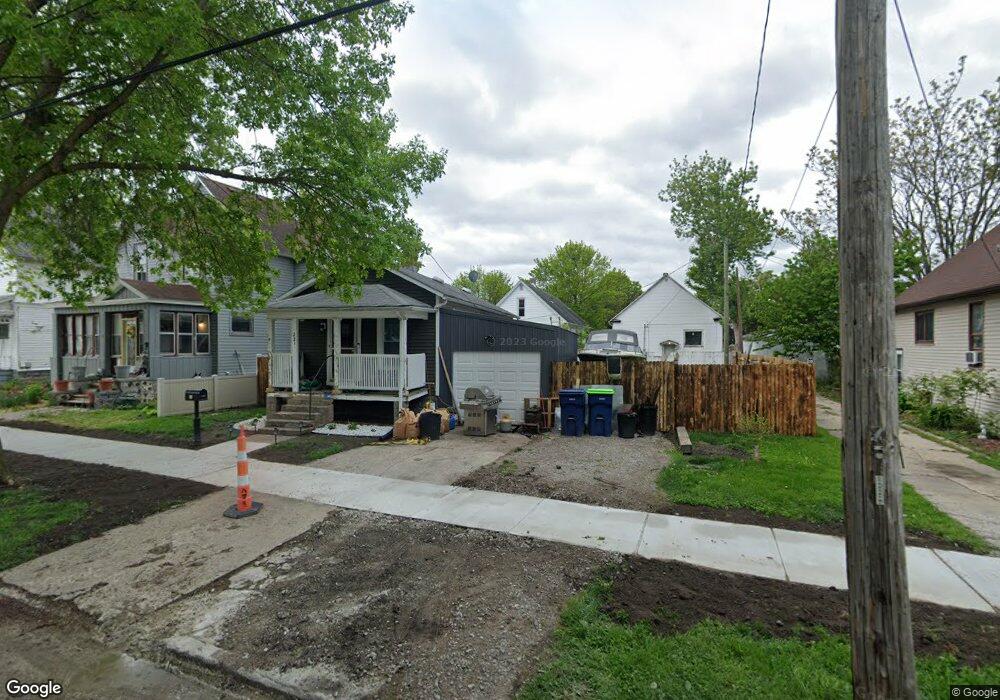
221 N Sherman St Bay City, MI 48708
Estimated Value: $55,000 - $115,000
1
Bed
1
Bath
1,152
Sq Ft
$68/Sq Ft
Est. Value
About This Home
This home is located at 221 N Sherman St, Bay City, MI 48708 and is currently estimated at $77,778, approximately $67 per square foot. 221 N Sherman St is a home located in Bay County with nearby schools including Washington Elementary School, Handy Middle School, and Bay City Central High School.
Ownership History
Date
Name
Owned For
Owner Type
Purchase Details
Closed on
Jul 14, 2020
Sold by
Bay County Land Bank Authority
Bought by
Reed Adam
Current Estimated Value
Purchase Details
Closed on
Apr 30, 2019
Sold by
City Of Bay City
Bought by
Bay County Land Bank Authority
Purchase Details
Closed on
May 10, 2018
Sold by
Walraven Iii Lawrence V
Bought by
County Treasurer
Purchase Details
Closed on
Oct 18, 2011
Sold by
Independent Bank
Bought by
Walraven Lawrence V
Purchase Details
Closed on
Sep 28, 2011
Sold by
Independent Mortgage Company
Bought by
Independent Bank
Purchase Details
Closed on
Oct 15, 2010
Sold by
Poirier Dennis
Bought by
Independent Mortgage Co and Independent Mortgage Co Central Mi
Purchase Details
Closed on
Sep 20, 2002
Sold by
Drzewicki Edward
Bought by
Poirier Dennis
Purchase Details
Closed on
Sep 13, 2002
Sold by
Wisniewski Barbara
Bought by
Drzewicki Edward
Purchase Details
Closed on
Sep 30, 1997
Sold by
Wisniewski Barbara
Bought by
Drzewicki Edward
Create a Home Valuation Report for This Property
The Home Valuation Report is an in-depth analysis detailing your home's value as well as a comparison with similar homes in the area
Home Values in the Area
Average Home Value in this Area
Purchase History
| Date | Buyer | Sale Price | Title Company |
|---|---|---|---|
| Reed Adam | $2,500 | Kukla Holly | |
| Bay County Land Bank Authority | -- | None Available | |
| County Treasurer | -- | -- | |
| Walraven Lawrence V | $7,000 | None Available | |
| Independent Bank | -- | None Available | |
| Independent Mortgage Co | $14,450 | None Available | |
| Poirier Dennis | $44,000 | -- | |
| Drzewicki Edward | $25,000 | -- | |
| Drzewicki Edward | $25,000 | -- |
Source: Public Records
Tax History Compared to Growth
Tax History
| Year | Tax Paid | Tax Assessment Tax Assessment Total Assessment is a certain percentage of the fair market value that is determined by local assessors to be the total taxable value of land and additions on the property. | Land | Improvement |
|---|---|---|---|---|
| 2025 | $746 | $22,000 | $0 | $0 |
| 2024 | $614 | $17,800 | $0 | $0 |
| 2023 | $584 | $16,750 | $0 | $0 |
| 2022 | $671 | $15,100 | $0 | $0 |
| 2021 | $953 | $14,000 | $14,000 | $0 |
| 2020 | $895 | $0 | $0 | $0 |
| 2019 | $895 | $0 | $0 | $0 |
| 2018 | $895 | $13,300 | $0 | $0 |
| 2017 | $2,285 | $13,150 | $0 | $0 |
| 2016 | $3,059 | $18,000 | $0 | $18,000 |
| 2015 | $1,597 | $17,000 | $0 | $17,000 |
| 2014 | $1,597 | $17,550 | $0 | $17,550 |
Source: Public Records
Map
Nearby Homes
- 302 N Farragut St
- 1517 11th St
- 208 S Sheridan St
- 251 N Van Buren St
- 321 N Birney St
- 301 N Van Buren St
- 510 N Farragut St
- 1712 10th St
- 609 11th St
- 224 N Madison Ave
- 1713 9th St
- 1010 6th Street 6th St
- 904 6th St
- 309 Harold St
- 501 S Mclellan St
- 1708 6th St
- 1213 Center Ave
- 909 Center Ave
- 620 S Mclellan St
- 701 15th St
- 219 N Sherman St
- 223 N Sherman St
- 226 N Farragut St
- 231 N Sherman St
- 217 N Sherman St
- 228 N Farragut St
- 222 N Farragut St
- 233 N Sherman St
- 211 N Sherman St
- 230 N Farragut St
- 218 N Sherman St
- 220 N Sherman St
- 216 N Sherman St
- 218 N Farragut St
- 235 N Sherman St
- 209 N Sherman St
- 230 N Sherman St
- 214 N Sherman St
- 214 N Farragut St
- 234 N Sherman St