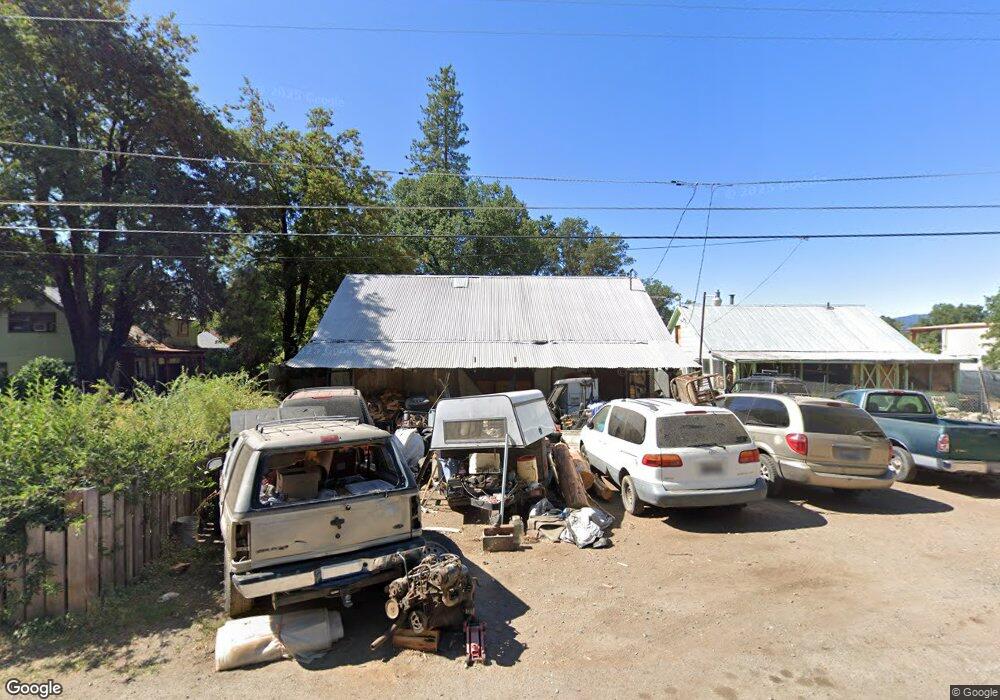
221 Trinity St Hayfork, CA 96041
Estimated Value: $110,000 - $202,373
2
Beds
1
Bath
1,000
Sq Ft
$163/Sq Ft
Est. Value
About This Home
This home is located at 221 Trinity St, Hayfork, CA 96041 and is currently estimated at $163,343, approximately $163 per square foot. 221 Trinity St is a home located in Trinity County with nearby schools including Hayfork High School.
Ownership History
Date
Name
Owned For
Owner Type
Purchase Details
Closed on
Feb 2, 2010
Sold by
Leard Lisa L and Hareid Don T
Bought by
Carroll E Diane
Current Estimated Value
Home Financials for this Owner
Home Financials are based on the most recent Mortgage that was taken out on this home.
Original Mortgage
$42,000
Outstanding Balance
$27,797
Interest Rate
5.03%
Mortgage Type
Seller Take Back
Estimated Equity
$135,546
Purchase Details
Closed on
Jan 26, 2010
Sold by
Reich Albert David
Bought by
Carroll E Diane
Home Financials for this Owner
Home Financials are based on the most recent Mortgage that was taken out on this home.
Original Mortgage
$42,000
Outstanding Balance
$27,797
Interest Rate
5.03%
Mortgage Type
Seller Take Back
Estimated Equity
$135,546
Purchase Details
Closed on
Jul 26, 2005
Sold by
Wilson James E and Leard Lisa L
Bought by
Leard Lisa L and Harcio Don T
Create a Home Valuation Report for This Property
The Home Valuation Report is an in-depth analysis detailing your home's value as well as a comparison with similar homes in the area
Home Values in the Area
Average Home Value in this Area
Purchase History
| Date | Buyer | Sale Price | Title Company |
|---|---|---|---|
| Carroll E Diane | $62,000 | Trinity Co Title Co | |
| Carroll E Diane | -- | Trinity Co Title Co | |
| Leard Lisa L | -- | -- |
Source: Public Records
Mortgage History
| Date | Status | Borrower | Loan Amount |
|---|---|---|---|
| Open | Carroll E Diane | $42,000 |
Source: Public Records
Tax History
| Year | Tax Paid | Tax Assessment Tax Assessment Total Assessment is a certain percentage of the fair market value that is determined by local assessors to be the total taxable value of land and additions on the property. | Land | Improvement |
|---|---|---|---|---|
| 2025 | $1,502 | $113,653 | $43,296 | $70,357 |
| 2024 | $1,484 | $111,426 | $42,448 | $68,978 |
| 2023 | $1,484 | $109,242 | $41,616 | $67,626 |
| 2022 | $1,460 | $107,100 | $40,800 | $66,300 |
| 2021 | $1,367 | $105,000 | $40,000 | $65,000 |
| 2020 | $872 | $73,887 | $35,753 | $38,134 |
| 2019 | $857 | $72,439 | $35,052 | $37,387 |
| 2018 | $836 | $71,019 | $34,365 | $36,654 |
| 2017 | $833 | $69,628 | $33,692 | $35,936 |
| 2016 | $806 | $68,264 | $33,032 | $35,232 |
| 2015 | $806 | $67,239 | $32,536 | $34,703 |
| 2014 | $797 | $65,923 | $31,899 | $34,024 |
Source: Public Records
Map
Nearby Homes
Your Personal Tour Guide
Ask me questions while you tour the home.