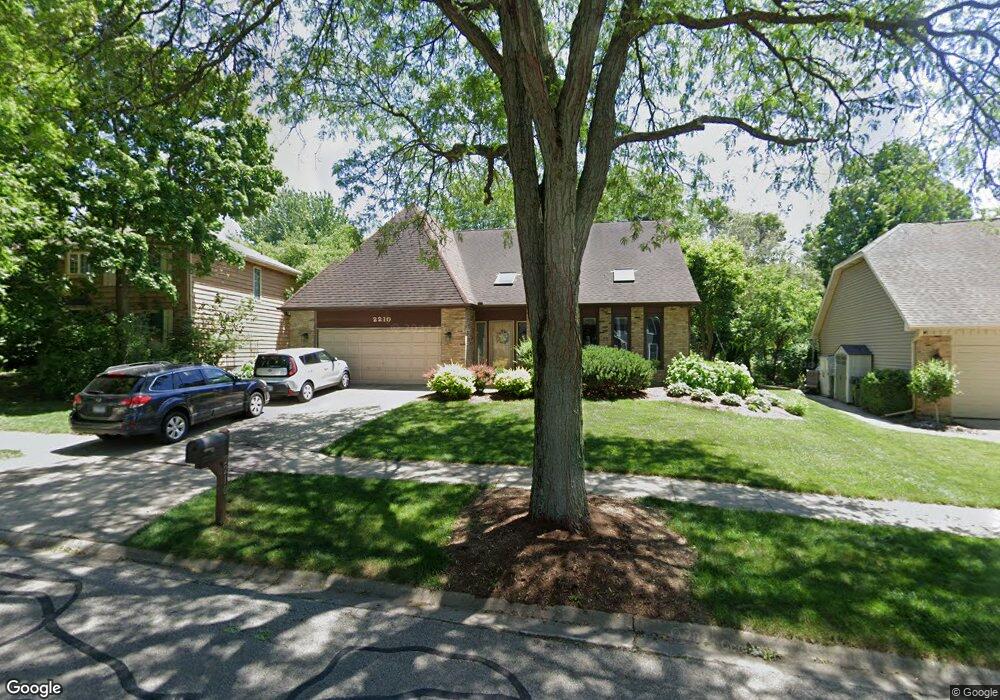
2210 University Dr Unit 3B Naperville, IL 60565
Walnut Ridge NeighborhoodEstimated Value: $815,491 - $913,000
4
Beds
4
Baths
3,122
Sq Ft
$275/Sq Ft
Est. Value
About This Home
This home is located at 2210 University Dr Unit 3B, Naperville, IL 60565 and is currently estimated at $858,623, approximately $275 per square foot. 2210 University Dr Unit 3B is a home located in Will County with nearby schools including River Woods Elementary School, Madison Jr High School, and Naperville Central High School.
Ownership History
Date
Name
Owned For
Owner Type
Purchase Details
Closed on
Jul 24, 2019
Sold by
Bigott Joseph C and Regican Bigott Geraldine
Bought by
Bigott Joseph C and Redican Bigott Geraldine
Current Estimated Value
Purchase Details
Closed on
Jul 13, 2003
Sold by
Merry Carroll E and Merry Jean L
Bought by
Bigott Joseph C and Redican Bigott Geraldine
Home Financials for this Owner
Home Financials are based on the most recent Mortgage that was taken out on this home.
Original Mortgage
$351,200
Interest Rate
5.69%
Mortgage Type
Purchase Money Mortgage
Purchase Details
Closed on
Jul 30, 1998
Sold by
Vandermeulen Thomas P and Vandermuelen Thomas P
Bought by
Merry Carroll E and Merry Jean L
Home Financials for this Owner
Home Financials are based on the most recent Mortgage that was taken out on this home.
Original Mortgage
$244,800
Interest Rate
7%
Create a Home Valuation Report for This Property
The Home Valuation Report is an in-depth analysis detailing your home's value as well as a comparison with similar homes in the area
Home Values in the Area
Average Home Value in this Area
Purchase History
| Date | Buyer | Sale Price | Title Company |
|---|---|---|---|
| Bigott Joseph C | -- | Attorney | |
| Bigott Joseph C | $439,000 | -- | |
| Merry Carroll E | $306,000 | -- |
Source: Public Records
Mortgage History
| Date | Status | Borrower | Loan Amount |
|---|---|---|---|
| Previous Owner | Bigott Joseph C | $351,200 | |
| Previous Owner | Merry Carroll E | $244,800 |
Source: Public Records
Tax History Compared to Growth
Tax History
| Year | Tax Paid | Tax Assessment Tax Assessment Total Assessment is a certain percentage of the fair market value that is determined by local assessors to be the total taxable value of land and additions on the property. | Land | Improvement |
|---|---|---|---|---|
| 2024 | $14,328 | $230,071 | $49,815 | $180,256 |
| 2023 | $14,328 | $207,010 | $44,822 | $162,188 |
| 2022 | $12,425 | $186,630 | $40,409 | $146,221 |
| 2021 | $11,598 | $174,502 | $37,783 | $136,719 |
| 2020 | $11,770 | $177,646 | $38,464 | $139,182 |
| 2019 | $11,370 | $169,186 | $36,632 | $132,554 |
| 2018 | $10,852 | $161,931 | $35,061 | $126,870 |
| 2017 | $10,450 | $153,489 | $33,233 | $120,256 |
| 2016 | $10,648 | $153,800 | $33,300 | $120,500 |
| 2015 | $10,551 | $147,500 | $31,900 | $115,600 |
| 2014 | $10,551 | $147,500 | $31,900 | $115,600 |
| 2013 | $10,551 | $143,200 | $31,000 | $112,200 |
Source: Public Records
Map
Nearby Homes
- 1120 Colgate Ct
- 743 Arlington Ave
- 2230 Keim Rd Unit 3B
- 710 Alexandria Dr
- 705 Potomac Ave
- 816 Spindletree Ave
- 805 Potomac Ave
- 2248 Aster Ct
- 25 W 500 Royce Rd
- 627 Nanak Ct
- 342 Dilorenzo Dr
- 2280 Barth Dr
- 336 Brooklea Ct
- 707 Crestview Dr
- 2697 Fox River Ln
- 2279 Kaskaskia Ct
- 2421 River Woods Dr
- 541 Boardman Cir
- 517 Sheffield Rd
- 302 Carriage Hill Rd
- 2208 University Dr
- 2212 University Dr
- 1109 Colgate Ct
- 1113 Colgate Ct
- 2206 University Dr
- 2214 University Dr Unit 3B
- 1105 Colgate Ct
- 1117 Colgate Ct Unit 3B
- 2211 University Dr
- 2209 University Dr
- 1101 Colgate Ct
- 2215 University Dr
- 2204 University Dr
- 2203 University Dr
- 2409 Marshall Ct
- 2405 Marshall Ct Unit 3B
- 2219 University Dr
- 1112 Colgate Ct
- 1116 Colgate Ct Unit 3B
- 2197 University Dr