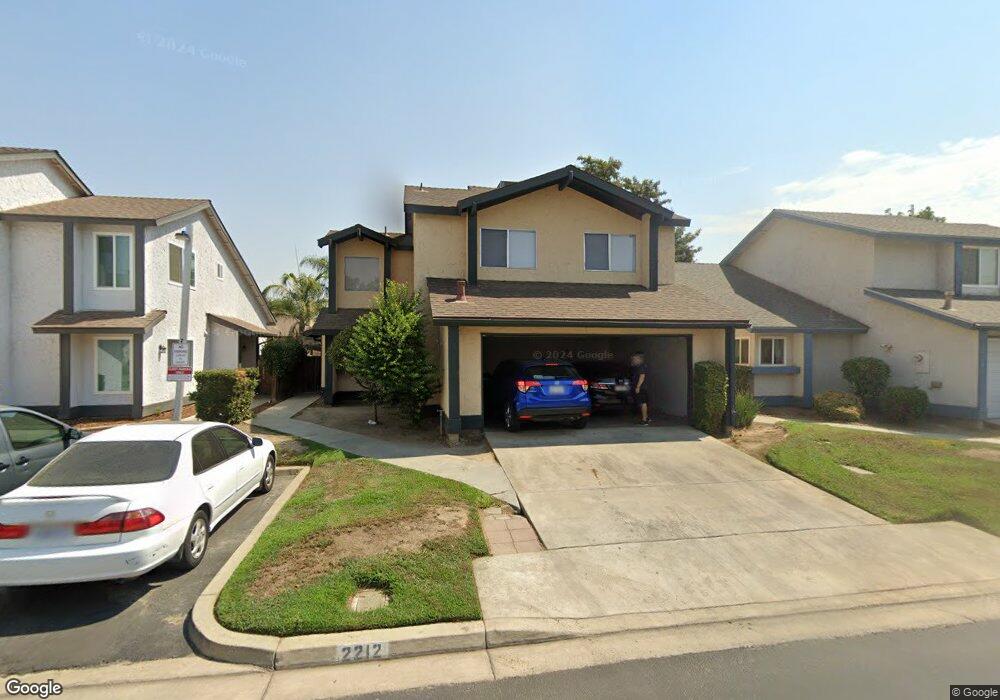
2212 N Bradley St Visalia, CA 93292
North Visalia NeighborhoodEstimated Value: $292,000 - $338,000
3
Beds
3
Baths
9,999
Sq Ft
$31/Sq Ft
Est. Value
About This Home
This home is located at 2212 N Bradley St, Visalia, CA 93292 and is currently estimated at $310,298, approximately $31 per square foot. 2212 N Bradley St is a home located in Tulare County with nearby schools including Four Creeks Elementary School, Valley Oak Middle School, and Golden West High School.
Ownership History
Date
Name
Owned For
Owner Type
Purchase Details
Closed on
Oct 27, 2019
Sold by
Fahmy Nasr Kamel
Bought by
Fahmy Nasr Kamel and The Nasr Fahmy Trust
Current Estimated Value
Purchase Details
Closed on
Dec 31, 2001
Sold by
Hud
Bought by
Fahmy Nasr Kamel
Home Financials for this Owner
Home Financials are based on the most recent Mortgage that was taken out on this home.
Original Mortgage
$44,100
Interest Rate
7.17%
Purchase Details
Closed on
Oct 3, 2001
Sold by
California Housing Finance Agency
Bought by
Hud
Purchase Details
Closed on
Jul 10, 2001
Sold by
Flores Esperanza
Bought by
California Housing Finance Agency
Purchase Details
Closed on
Jul 31, 1995
Sold by
Semonious Theodore F
Bought by
Flores Esperanza
Home Financials for this Owner
Home Financials are based on the most recent Mortgage that was taken out on this home.
Original Mortgage
$82,720
Interest Rate
7.88%
Mortgage Type
FHA
Create a Home Valuation Report for This Property
The Home Valuation Report is an in-depth analysis detailing your home's value as well as a comparison with similar homes in the area
Home Values in the Area
Average Home Value in this Area
Purchase History
| Date | Buyer | Sale Price | Title Company |
|---|---|---|---|
| Fahmy Nasr Kamel | -- | None Available | |
| Fahmy Nasr Kamel | $63,000 | Fidelity National Title Co | |
| Hud | -- | -- | |
| California Housing Finance Agency | $86,403 | -- | |
| Flores Esperanza | $83,000 | Chicago Title Co |
Source: Public Records
Mortgage History
| Date | Status | Borrower | Loan Amount |
|---|---|---|---|
| Closed | Fahmy Nasr Kamel | $44,100 | |
| Previous Owner | Flores Esperanza | $82,720 |
Source: Public Records
Tax History Compared to Growth
Tax History
| Year | Tax Paid | Tax Assessment Tax Assessment Total Assessment is a certain percentage of the fair market value that is determined by local assessors to be the total taxable value of land and additions on the property. | Land | Improvement |
|---|---|---|---|---|
| 2025 | $1,032 | $93,070 | $29,544 | $63,526 |
| 2024 | $1,032 | $91,246 | $28,965 | $62,281 |
| 2023 | $1,005 | $89,458 | $28,398 | $61,060 |
| 2022 | $962 | $87,705 | $27,842 | $59,863 |
| 2021 | $963 | $85,985 | $27,296 | $58,689 |
| 2020 | $950 | $85,103 | $27,016 | $58,087 |
| 2019 | $929 | $83,434 | $26,486 | $56,948 |
| 2018 | $902 | $81,798 | $25,967 | $55,831 |
| 2017 | $898 | $80,194 | $25,458 | $54,736 |
| 2016 | $878 | $78,622 | $24,959 | $53,663 |
| 2015 | $854 | $77,441 | $24,584 | $52,857 |
| 2014 | $854 | $75,924 | $24,102 | $51,822 |
Source: Public Records
Map
Nearby Homes
- 2218 N Oakhurst St
- 2241 N Edison St
- 2321 N Michael St
- 1145 E Ferguson Ave
- 2419 N Clark St
- 4109 E Oakridge Ave
- 2420 N Michael St
- 1205 E Ferguson Ave
- 2435 N Clark St
- 4105 E Sunnyview Ave
- 4115 E Sunnyview Ave
- 2447 N Michael St
- 1146 E Buena Vista Ave
- 841 E Prospect Ave
- 0 N Ben Maddox Way NE Unit 238146
- 1502 E Buena Vista Ave
- 1704 E Babcock Ave
- 1633 N Tipton St
- 1730 E Babcock Ave
- 1835 E Babcock Ave
- 2204 N Bradley St
- 2220 N Bradley St
- 934 E Ferguson Ave
- 940 E Ferguson Ave
- 1005 E Babcock Ave
- 1009 E Babcock Ave
- 1000 E Ferguson Ave
- 2215 N Bradley St
- 1004 E Ferguson Ave
- 1017 E Babcock Ave
- 2221 N Bradley St
- 2207 N Bradley St
- 1021 E Babcock Ave
- 2227 N Bradley St
- 1008 E Ferguson Ave
- 2233 N Bradley St
- 2141 N Bradley St
- 1023 E Babcock Ave
- 1016 E Ferguson Ave
- 2239 N Bradley St