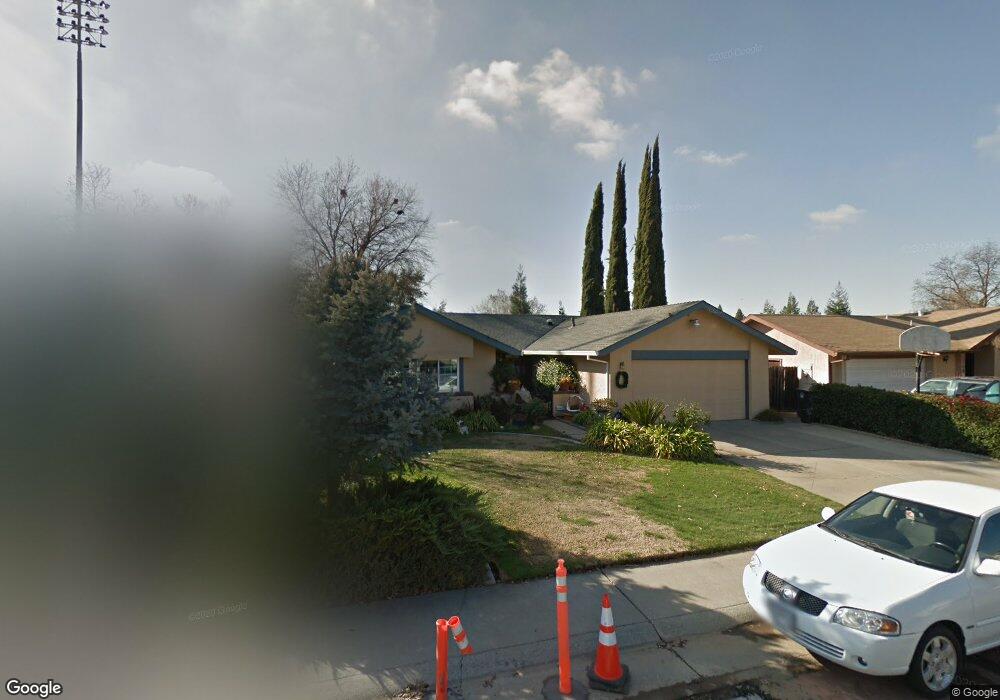
2212 Trails Ct Rancho Cordova, CA 95670
Mills Ranch NeighborhoodEstimated Value: $441,000 - $495,000
4
Beds
2
Baths
1,476
Sq Ft
$315/Sq Ft
Est. Value
About This Home
This home is located at 2212 Trails Ct, Rancho Cordova, CA 95670 and is currently estimated at $464,770, approximately $314 per square foot. 2212 Trails Ct is a home located in Sacramento County with nearby schools including Peter J. Shields Elementary School, Riverview STEM Elementary School, and Mills Middle School.
Ownership History
Date
Name
Owned For
Owner Type
Purchase Details
Closed on
Nov 4, 2022
Sold by
Trujillo Linda M
Bought by
Sammy L And Lind M Trujillo Revocable Living
Current Estimated Value
Purchase Details
Closed on
Oct 21, 2020
Sold by
Trujillo Linda M and Summay L Trujillo & Lind Am Tr
Bought by
Trujillo Linda M
Home Financials for this Owner
Home Financials are based on the most recent Mortgage that was taken out on this home.
Original Mortgage
$169,000
Interest Rate
2.8%
Mortgage Type
New Conventional
Purchase Details
Closed on
Nov 13, 2014
Sold by
Trujillo Sammy L and Trujillo Linda M
Bought by
The Sammy L Trujillo & Linda M Trujillo
Purchase Details
Closed on
Dec 4, 1996
Sold by
Easterbrook Keith P and Easterbrook Debra C
Bought by
Trujillo Sammy L and Trujillo Linda
Home Financials for this Owner
Home Financials are based on the most recent Mortgage that was taken out on this home.
Original Mortgage
$124,630
Interest Rate
7.86%
Mortgage Type
VA
Create a Home Valuation Report for This Property
The Home Valuation Report is an in-depth analysis detailing your home's value as well as a comparison with similar homes in the area
Home Values in the Area
Average Home Value in this Area
Purchase History
| Date | Buyer | Sale Price | Title Company |
|---|---|---|---|
| Sammy L And Lind M Trujillo Revocable Living | -- | -- | |
| Trujillo Linda M | -- | Old Republic Title Company | |
| The Sammy L Trujillo & Linda M Trujillo | -- | None Available | |
| Trujillo Sammy L | $124,000 | Placer Title Company |
Source: Public Records
Mortgage History
| Date | Status | Borrower | Loan Amount |
|---|---|---|---|
| Previous Owner | Trujillo Linda M | $169,000 | |
| Previous Owner | Trujillo Sammy L | $124,630 |
Source: Public Records
Tax History Compared to Growth
Tax History
| Year | Tax Paid | Tax Assessment Tax Assessment Total Assessment is a certain percentage of the fair market value that is determined by local assessors to be the total taxable value of land and additions on the property. | Land | Improvement |
|---|---|---|---|---|
| 2025 | $2,403 | $201,930 | $77,020 | $124,910 |
| 2024 | $2,403 | $197,971 | $75,510 | $122,461 |
| 2023 | $2,354 | $194,090 | $74,030 | $120,060 |
| 2022 | $2,322 | $190,285 | $72,579 | $117,706 |
| 2021 | $2,276 | $186,555 | $71,156 | $115,399 |
| 2020 | $2,260 | $184,643 | $70,427 | $114,216 |
| 2019 | $2,222 | $181,024 | $69,047 | $111,977 |
| 2018 | $2,165 | $177,476 | $67,694 | $109,782 |
| 2017 | $2,110 | $173,997 | $66,367 | $107,630 |
| 2016 | $2,051 | $170,586 | $65,066 | $105,520 |
| 2015 | $1,949 | $168,024 | $64,089 | $103,935 |
| 2014 | $2,070 | $164,734 | $62,834 | $101,900 |
Source: Public Records
Map
Nearby Homes
- 2222 River Trails Cir
- 2203 River Trails Cir
- 2240 Chase Dr
- 2129 Danbury Way
- 10465 Rugby Ct
- 2331 Pecan Grove Way
- 10532 Coloma Rd
- 10357 Daniel Way
- 10493 Georgetown Dr
- 10343 Holmes Way
- 10412 Dolecetto Dr
- 10677 Beclan Dr
- 2628 Tronero Way
- 2133 Rossmoor Dr
- 2640 Tronero Way
- 2344 Glenfaire Dr
- 10228 Coloma Rd
- 6233 Gobernadores Ln
- 2420 Glenfaire Dr
- 2540 El Segundo Dr
- 2208 Trails Ct
- 2216 Trails Ct
- 2204 Trails Ct
- 2220 Trails Ct
- 2205 Trails Ct
- 2209 Trails Ct
- 2200 Trails Ct
- 2201 Trails Ct
- 2215 Trails Ct
- 2224 Trails Ct
- 2217 Trails Ct
- 10348 Ambassador Dr
- 10365 Sportsman Ct
- 10352 Ambassador Dr
- 10363 Sportsman Ct
- 10364 Sportsman Ct
- 10356 Ambassador Dr
- 10361 Sportsman Ct
- 10360 Ambassador Dr
- 10362 Sportsman Ct