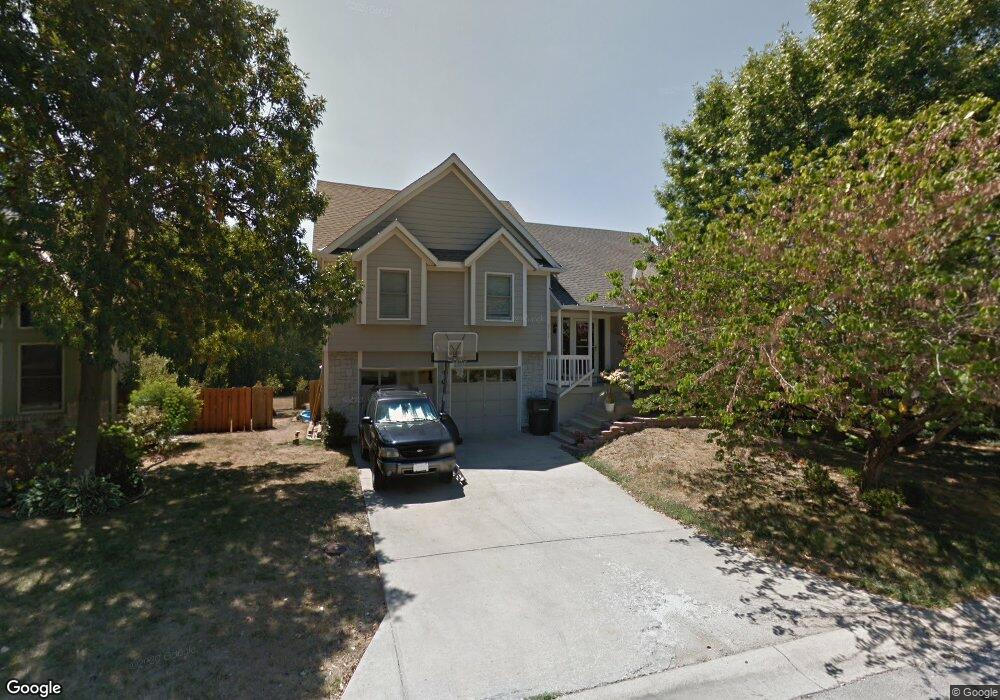
22125 W 48th St Shawnee, KS 66226
Estimated Value: $366,000 - $384,000
3
Beds
3
Baths
1,461
Sq Ft
$258/Sq Ft
Est. Value
About This Home
This home is located at 22125 W 48th St, Shawnee, KS 66226 and is currently estimated at $377,505, approximately $258 per square foot. 22125 W 48th St is a home located in Johnson County with nearby schools including Riverview Elementary School, Mill Creek Middle School, and Mill Valley High School.
Ownership History
Date
Name
Owned For
Owner Type
Purchase Details
Closed on
Dec 7, 2011
Sold by
Long Corey and Long Keith
Bought by
Long Corey and Long Keith
Current Estimated Value
Home Financials for this Owner
Home Financials are based on the most recent Mortgage that was taken out on this home.
Original Mortgage
$186,945
Outstanding Balance
$130,252
Interest Rate
4.4%
Mortgage Type
FHA
Estimated Equity
$247,253
Purchase Details
Closed on
Oct 13, 2008
Sold by
Carpenter Shawn E and Carpenter Rachelle L
Bought by
Long Corey
Home Financials for this Owner
Home Financials are based on the most recent Mortgage that was taken out on this home.
Original Mortgage
$189,844
Interest Rate
6.35%
Mortgage Type
FHA
Purchase Details
Closed on
Aug 18, 2003
Sold by
Rice Eric E and Rice Jamie D
Bought by
Carpenter Shawn E and Carpenter Rachelle L
Home Financials for this Owner
Home Financials are based on the most recent Mortgage that was taken out on this home.
Original Mortgage
$184,100
Interest Rate
5.51%
Mortgage Type
VA
Create a Home Valuation Report for This Property
The Home Valuation Report is an in-depth analysis detailing your home's value as well as a comparison with similar homes in the area
Home Values in the Area
Average Home Value in this Area
Purchase History
| Date | Buyer | Sale Price | Title Company |
|---|---|---|---|
| Long Corey | -- | First United Title Agency | |
| Long Corey | -- | Old Republic Title Co | |
| Carpenter Shawn E | -- | Stewart Title Inc |
Source: Public Records
Mortgage History
| Date | Status | Borrower | Loan Amount |
|---|---|---|---|
| Open | Long Corey | $186,945 | |
| Closed | Long Corey | $189,844 | |
| Previous Owner | Carpenter Shawn E | $184,100 |
Source: Public Records
Tax History Compared to Growth
Tax History
| Year | Tax Paid | Tax Assessment Tax Assessment Total Assessment is a certain percentage of the fair market value that is determined by local assessors to be the total taxable value of land and additions on the property. | Land | Improvement |
|---|---|---|---|---|
| 2024 | $4,513 | $38,974 | $7,818 | $31,156 |
| 2023 | $4,554 | $38,767 | $7,818 | $30,949 |
| 2022 | $4,355 | $36,317 | $7,446 | $28,871 |
| 2021 | $3,883 | $31,061 | $6,770 | $24,291 |
| 2020 | $3,607 | $28,578 | $5,893 | $22,685 |
| 2019 | $3,538 | $27,623 | $5,360 | $22,263 |
| 2018 | $3,372 | $26,082 | $5,360 | $20,722 |
| 2017 | $3,333 | $25,151 | $4,474 | $20,677 |
| 2016 | $3,219 | $23,990 | $4,474 | $19,516 |
| 2015 | $3,111 | $22,851 | $4,474 | $18,377 |
| 2013 | -- | $21,747 | $4,474 | $17,273 |
Source: Public Records
Map
Nearby Homes
- 5005 Hilltop Dr
- 22014 W 47th Terrace
- 22014 W 51st St
- 5116 Payne St
- 4638 Aminda St
- 22625 W 49th St
- 22714 W 49th St
- 22611 W 46th Terrace
- 22115 W 51st Terrace
- 4713 Lone Elm
- 22910 W 51st St
- 22912 W 47th Terrace
- 21525 W 51st St
- 5206 Round Prairie St
- 9307 Aminda St
- 9303 Aminda St
- 9313 Aminda St
- 9305 Aminda St
- 21408 W 50th St
- 21804 W 52nd Terrace
- 22121 W 48th St
- 4756 Chouteau St
- 4752 Chouteau St
- 22117 W 48th St
- 4751 Chouteau St
- 22116 W 48th St
- 4748 Chouteau St
- 22113 W 48th St
- 4747 Chouteau St
- 22112 W 48th St
- 22109 W 48th St
- 4748 Roundtree Ct
- 4743 Chouteau St
- 4740 Chouteau St
- 4744 Roundtree Ct
- 22105 W 48th St
- 4739 Chouteau St
- 22100 W 48th St
- 4736 Chouteau St
- 4740 Roundtree Ct