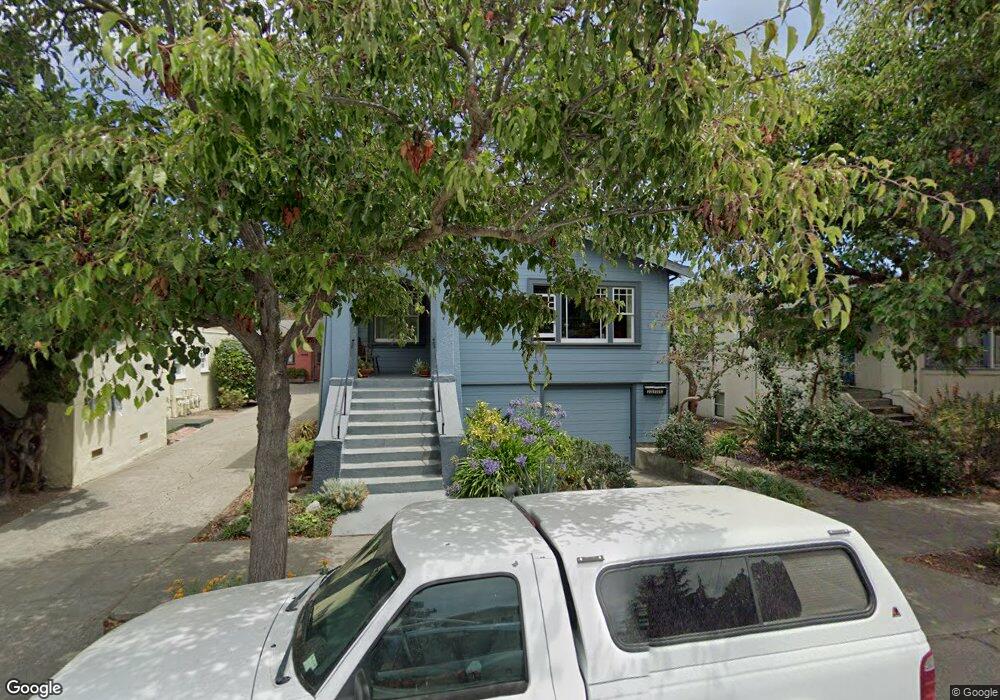
2215 Curtis St Berkeley, CA 94702
West Berkeley NeighborhoodEstimated Value: $958,000 - $1,149,000
Studio
--
Bath
1,174
Sq Ft
$898/Sq Ft
Est. Value
About This Home
This home is located at 2215 Curtis St, Berkeley, CA 94702 and is currently estimated at $1,054,109, approximately $897 per square foot. 2215 Curtis St is a home located in Alameda County with nearby schools including Rosa Parks Elementary School, Ruth Acty Elementary, and Berkeley Arts Magnet at Whittier School.
Ownership History
Date
Name
Owned For
Owner Type
Purchase Details
Closed on
Mar 6, 2023
Sold by
Pellerin Louise D and Pellerin Jeffery M
Bought by
Pellerin-Johnston Trust
Current Estimated Value
Purchase Details
Closed on
Feb 20, 1996
Sold by
Greinke Kathleen Y
Bought by
Johnston Jeffery M and Pellerin Louise D
Home Financials for this Owner
Home Financials are based on the most recent Mortgage that was taken out on this home.
Original Mortgage
$146,000
Interest Rate
7.1%
Purchase Details
Closed on
May 30, 1995
Sold by
First Trust Corp
Bought by
Greinke Kathleen Y
Home Financials for this Owner
Home Financials are based on the most recent Mortgage that was taken out on this home.
Original Mortgage
$95,900
Interest Rate
8.36%
Purchase Details
Closed on
Nov 23, 1994
Sold by
First Trust Corp
Bought by
First Trust Corp
Create a Home Valuation Report for This Property
The Home Valuation Report is an in-depth analysis detailing your home's value as well as a comparison with similar homes in the area
Home Values in the Area
Average Home Value in this Area
Purchase History
| Date | Buyer | Sale Price | Title Company |
|---|---|---|---|
| Pellerin-Johnston Trust | -- | -- | |
| Johnston Jeffery M | $182,500 | American Title Ins Co | |
| Greinke Kathleen Y | $137,000 | American Title Insurance Co | |
| First Trust Corp | $123,000 | -- |
Source: Public Records
Mortgage History
| Date | Status | Borrower | Loan Amount |
|---|---|---|---|
| Previous Owner | Johnston Jeffery M | $146,000 | |
| Previous Owner | Greinke Kathleen Y | $95,900 |
Source: Public Records
Tax History
| Year | Tax Paid | Tax Assessment Tax Assessment Total Assessment is a certain percentage of the fair market value that is determined by local assessors to be the total taxable value of land and additions on the property. | Land | Improvement |
|---|---|---|---|---|
| 2025 | $8,019 | $296,161 | $91,031 | $212,130 |
| 2024 | $8,019 | $290,216 | $89,246 | $207,970 |
| 2023 | $7,764 | $291,389 | $87,496 | $203,893 |
| 2022 | $7,495 | $278,677 | $85,781 | $199,896 |
| 2021 | $7,465 | $273,076 | $84,099 | $195,977 |
| 2020 | $6,928 | $277,205 | $83,237 | $193,968 |
| 2019 | $6,494 | $271,770 | $81,605 | $190,165 |
| 2018 | $6,334 | $266,444 | $80,006 | $186,438 |
| 2017 | $6,085 | $261,220 | $78,437 | $182,783 |
| 2016 | $5,767 | $256,100 | $76,900 | $179,200 |
| 2015 | $5,664 | $252,254 | $75,745 | $176,509 |
| 2014 | $5,656 | $247,314 | $74,262 | $173,052 |
Source: Public Records
Map
Nearby Homes
- 2231 Byron St
- 2324 Browning St
- 1039 Channing Way
- 1919 Curtis St
- 2341 9th St
- 2304 Edwards St
- 2423 10th St
- 1118 Dwight Way
- 917 Channing Way
- 2350 Sacramento St
- 1050 Allston Way
- 2437 Acton St
- 1128 Delaware St
- 2220 7th St
- 2238 7th St
- 1431 Dwight Way
- 1135 Parker St
- 1728 Curtis St
- 1411 Hearst Ave Unit 2
- 2411 Sixth St
- 2211 Curtis St
- 2219 Curtis St
- 2205 Curtis St
- 2223 Curtis St
- 2227 Curtis St
- 2214 Browning St
- 2216 Browning St
- 2212 Browning St
- 2218 Browning St
- 2210 Browning St
- 1206 Allston Way
- 1200 Allston Way
- 1208 Allston Way
- 2231 Curtis St
- 1204 Allston Way
- 2224 Browning St
- 1210 Allston Way
- 2214 Curtis St
- 2210 Curtis St Unit A
- 2210 Curtis St
Your Personal Tour Guide
Ask me questions while you tour the home.