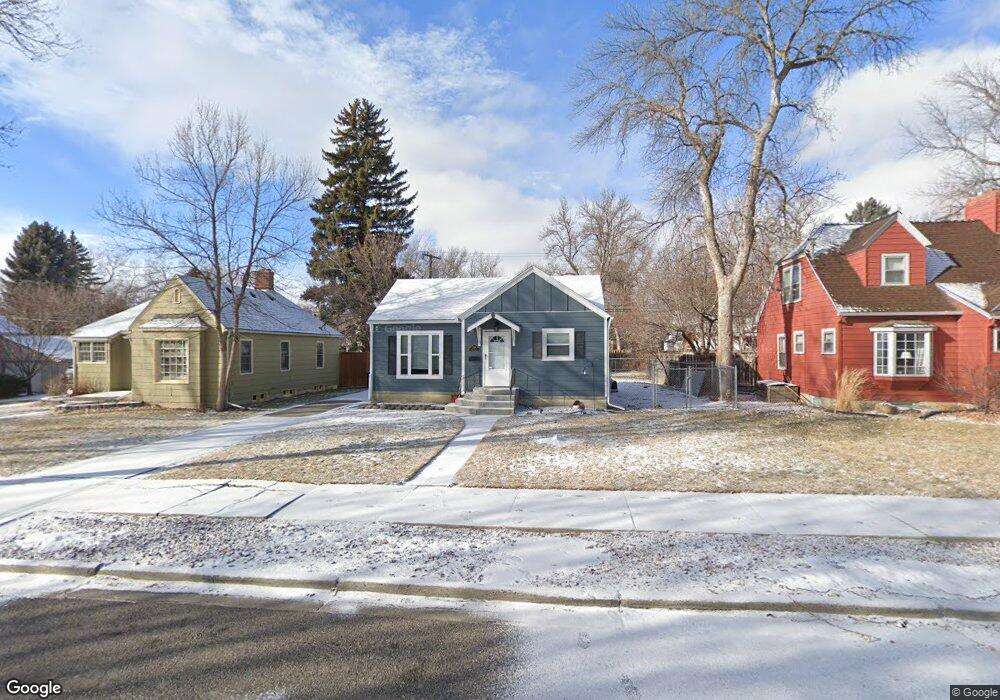
2218 Elm St Billings, MT 59101
Hilands NeighborhoodEstimated Value: $346,039 - $415,000
4
Beds
2
Baths
1,818
Sq Ft
$211/Sq Ft
Est. Value
About This Home
This home is located at 2218 Elm St, Billings, MT 59101 and is currently estimated at $384,010, approximately $211 per square foot. 2218 Elm St is a home located in Yellowstone County with nearby schools including McKinley School, Lewis & Clark Junior High School, and Billings Senior High School.
Ownership History
Date
Name
Owned For
Owner Type
Purchase Details
Closed on
Feb 15, 2018
Sold by
Anderson Rachel M
Bought by
Rochin Mark J and Rochin Chantel A
Current Estimated Value
Home Financials for this Owner
Home Financials are based on the most recent Mortgage that was taken out on this home.
Original Mortgage
$185,576
Outstanding Balance
$157,676
Interest Rate
4.12%
Mortgage Type
FHA
Estimated Equity
$226,334
Purchase Details
Closed on
Feb 25, 1997
Sold by
Carlson Lois Mae
Bought by
Anderson Rachel M
Create a Home Valuation Report for This Property
The Home Valuation Report is an in-depth analysis detailing your home's value as well as a comparison with similar homes in the area
Home Values in the Area
Average Home Value in this Area
Purchase History
| Date | Buyer | Sale Price | Title Company |
|---|---|---|---|
| Rochin Mark J | -- | -- | |
| Anderson Rachel M | -- | Ctic |
Source: Public Records
Mortgage History
| Date | Status | Borrower | Loan Amount |
|---|---|---|---|
| Open | Rochin Mark J | $185,576 |
Source: Public Records
Tax History
| Year | Tax Paid | Tax Assessment Tax Assessment Total Assessment is a certain percentage of the fair market value that is determined by local assessors to be the total taxable value of land and additions on the property. | Land | Improvement |
|---|---|---|---|---|
| 2025 | $2,745 | $329,800 | $60,613 | $269,187 |
| 2024 | $2,745 | $279,500 | $54,505 | $224,995 |
| 2023 | $2,734 | $279,500 | $54,505 | $224,995 |
| 2022 | $2,488 | $223,000 | $0 | $0 |
| 2021 | $2,371 | $223,000 | $0 | $0 |
| 2020 | $2,237 | $200,400 | $0 | $0 |
| 2019 | $2,130 | $200,400 | $0 | $0 |
| 2018 | $1,952 | $179,100 | $0 | $0 |
| 2017 | $1,693 | $182,900 | $0 | $0 |
| 2016 | $1,806 | $171,600 | $0 | $0 |
| 2015 | $1,760 | $171,600 | $0 | $0 |
| 2014 | $1,375 | $69,536 | $0 | $0 |
Source: Public Records
Map
Nearby Homes
- 2223 Elm St
- 2317 Pine St
- 240 Beverly Hill Blvd
- 545 Beverly Hill Blvd
- 509 Avenue E
- 607 Avenue F Unit 4
- 202 Avenue E
- 1907 St Peter Ln
- 1933 St Peter Ln
- 1919 St Peter Ln
- 1929 St Peter Ln
- 1925 St Peter Ln
- 1913 St Peter Ln
- 413 Rimrock Rd
- 609 Avenue D
- 229 Avenue B
- 641 Avenue C
- 803 Parkhill Dr
- 41 Avenue B
- 135 Grand Ave
Your Personal Tour Guide
Ask me questions while you tour the home.