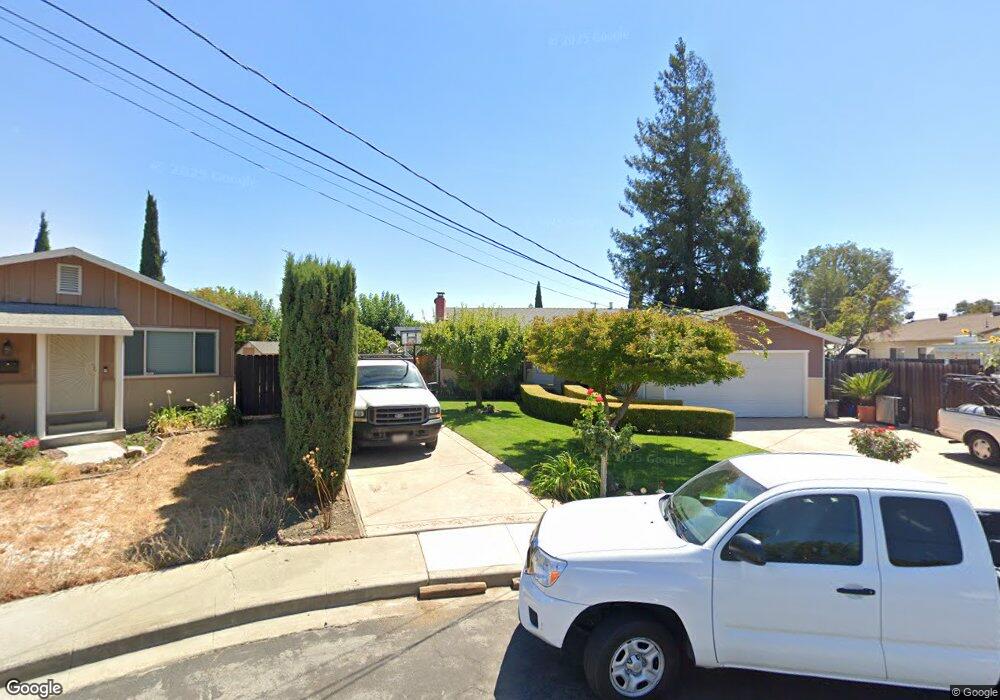
2219 Balsa Ct Concord, CA 94520
Sun Terrace NeighborhoodEstimated Value: $652,000 - $763,415
3
Beds
2
Baths
1,134
Sq Ft
$629/Sq Ft
Est. Value
About This Home
This home is located at 2219 Balsa Ct, Concord, CA 94520 and is currently estimated at $713,104, approximately $628 per square foot. 2219 Balsa Ct is a home located in Contra Costa County with nearby schools including Sun Terrace Elementary School, El Dorado Middle School, and Mt. Diablo High School.
Ownership History
Date
Name
Owned For
Owner Type
Purchase Details
Closed on
Jul 13, 2023
Sold by
Cobian Luis
Bought by
Cabrera Pablo and Cabrera Norma
Current Estimated Value
Home Financials for this Owner
Home Financials are based on the most recent Mortgage that was taken out on this home.
Original Mortgage
$161,000
Outstanding Balance
$145,874
Interest Rate
6.18%
Mortgage Type
New Conventional
Estimated Equity
$567,230
Purchase Details
Closed on
Feb 5, 2009
Sold by
Eufracio N Elodia
Bought by
Navarro Daniel Garcia
Home Financials for this Owner
Home Financials are based on the most recent Mortgage that was taken out on this home.
Original Mortgage
$194,400
Interest Rate
5.01%
Mortgage Type
Purchase Money Mortgage
Purchase Details
Closed on
Feb 2, 2009
Sold by
Cobian Veronica
Bought by
Cobian Luis
Home Financials for this Owner
Home Financials are based on the most recent Mortgage that was taken out on this home.
Original Mortgage
$194,400
Interest Rate
5.01%
Mortgage Type
Purchase Money Mortgage
Purchase Details
Closed on
Apr 5, 2005
Sold by
Navarro Daniel
Bought by
Garcia Navarro Daniel
Home Financials for this Owner
Home Financials are based on the most recent Mortgage that was taken out on this home.
Original Mortgage
$400,000
Interest Rate
5.84%
Mortgage Type
Fannie Mae Freddie Mac
Purchase Details
Closed on
Aug 19, 2004
Sold by
Navarro Daniel
Bought by
Navarro Daniel and Garcia Navarro Daniel
Home Financials for this Owner
Home Financials are based on the most recent Mortgage that was taken out on this home.
Original Mortgage
$431,300
Interest Rate
7.49%
Mortgage Type
Stand Alone Refi Refinance Of Original Loan
Purchase Details
Closed on
Dec 23, 2003
Sold by
Oneal Jeffery D and Oneal Jennifer
Bought by
Navarro Daniel
Home Financials for this Owner
Home Financials are based on the most recent Mortgage that was taken out on this home.
Original Mortgage
$312,000
Interest Rate
6.99%
Mortgage Type
Purchase Money Mortgage
Purchase Details
Closed on
Aug 23, 2002
Sold by
Oneal Jeffery D
Bought by
Oneal Jeffery D and Oneal Jennifer
Purchase Details
Closed on
Dec 19, 1997
Sold by
Martin Kevin J and Martin Ellen E
Bought by
Oneal Jeffrey D
Home Financials for this Owner
Home Financials are based on the most recent Mortgage that was taken out on this home.
Original Mortgage
$155,700
Interest Rate
7.22%
Mortgage Type
FHA
Create a Home Valuation Report for This Property
The Home Valuation Report is an in-depth analysis detailing your home's value as well as a comparison with similar homes in the area
Home Values in the Area
Average Home Value in this Area
Purchase History
| Date | Buyer | Sale Price | Title Company |
|---|---|---|---|
| Cabrera Pablo | $220,000 | First American Title | |
| Navarro Daniel Garcia | -- | Old Republic Title Company | |
| Cobian Luis | -- | Old Republic Title Company | |
| Cobian Luis | $243,000 | Old Republic Title Company | |
| Garcia Navarro Daniel | $200,000 | North American Title | |
| Navarro Daniel | -- | Chicago Title | |
| Garcia Navarro Daniel | -- | Chicago Title | |
| Navarro Daniel | $390,000 | Chicago Title Co | |
| Oneal Jeffery D | -- | North American Title | |
| Oneal Jeffrey D | $159,000 | First American Title Guarant |
Source: Public Records
Mortgage History
| Date | Status | Borrower | Loan Amount |
|---|---|---|---|
| Open | Cabrera Pablo | $161,000 | |
| Previous Owner | Cobian Luis | $194,400 | |
| Previous Owner | Garcia Navarro Daniel | $400,000 | |
| Previous Owner | Navarro Daniel | $431,300 | |
| Previous Owner | Navarro Daniel | $312,000 | |
| Previous Owner | Oneal Jeffrey D | $155,700 | |
| Closed | Navarro Daniel | $78,000 | |
| Closed | Garcia Navarro Daniel | $100,000 |
Source: Public Records
Tax History
| Year | Tax Paid | Tax Assessment Tax Assessment Total Assessment is a certain percentage of the fair market value that is determined by local assessors to be the total taxable value of land and additions on the property. | Land | Improvement |
|---|---|---|---|---|
| 2025 | $8,893 | $714,000 | $510,000 | $204,000 |
| 2024 | $4,246 | $700,000 | $500,000 | $200,000 |
| 2023 | $4,246 | $300,759 | $210,411 | $90,348 |
| 2022 | $4,174 | $294,863 | $206,286 | $88,577 |
| 2021 | $4,060 | $289,083 | $202,242 | $86,841 |
| 2019 | $3,974 | $280,511 | $196,245 | $84,266 |
| 2018 | $3,816 | $275,012 | $192,398 | $82,614 |
| 2017 | $3,680 | $269,621 | $188,626 | $80,995 |
| 2016 | $3,562 | $264,335 | $184,928 | $79,407 |
| 2015 | $3,502 | $260,366 | $182,151 | $78,215 |
| 2014 | $3,424 | $255,266 | $178,583 | $76,683 |
Source: Public Records
Map
Nearby Homes
- 3485 Hillsborough Dr
- 2227 Dalis Dr Unit 159
- 3617 Sanford St
- 2097 Dalis Dr Unit 79
- 2219 Acacia Dr
- 2069 Olivera Rd Unit E
- 2197 Dalis Dr Unit 124
- 2067 Olivera Rd Unit B
- 2917 Knoll Dr
- 3242 Ida Dr
- 2102 Overhill Rd
- 2868 Avon Ave
- 2283 Panoramic Dr
- 3185 Claudia Dr
- 3179 Meadowbrook Dr
- 2819 Kay Ave
- 2766 Argyll Ave
- 2780 Argyll Ave
- 2653 Garden Ave
- 2829 Hilltop Rd
- 2225 Balsa Ct
- 3453 Cranbrook Way
- 3460 Halifax Way
- 2218 Labrador St
- 3466 Halifax Way
- 2212 Labrador St
- 3472 Halifax Way
- 3448 Halifax Way
- 2224 Balsa Ct
- 2218 Balsa Ct
- 3478 Halifax Way
- 2212 Balsa Ct
- 114331 Labrador
- 3461 Halifax Way
- 3484 Halifax Way
- 2219 Labrador St
- 3467 Halifax Way
- 2225 Labrador St
- 2219 Vancouver Way
- 2213 Labrador St
Your Personal Tour Guide
Ask me questions while you tour the home.