
Seller's Agent in 2016
Paige Charnick
Beach Equities
(562) 597-8413
3 in this area
87 Total Sales
Estimated Value: $1,377,107 - $1,462,000
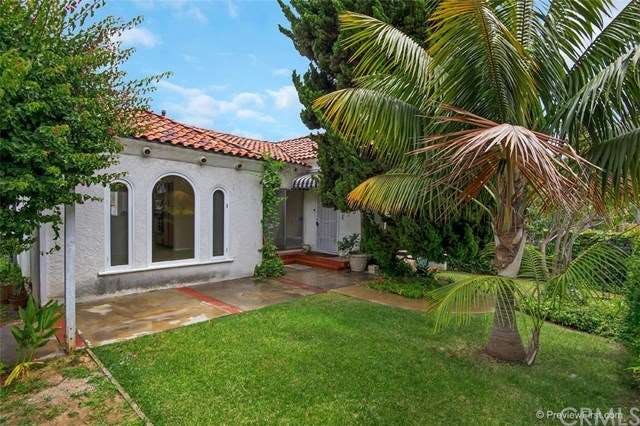
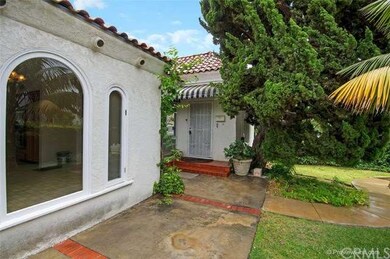
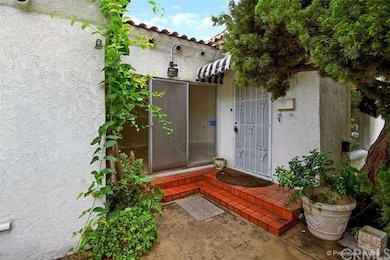
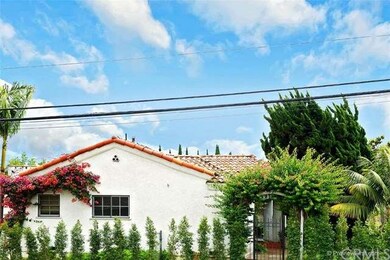
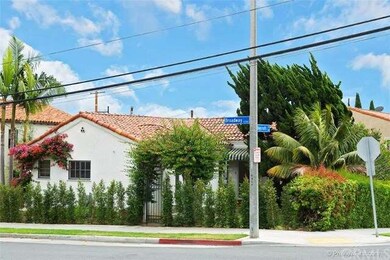
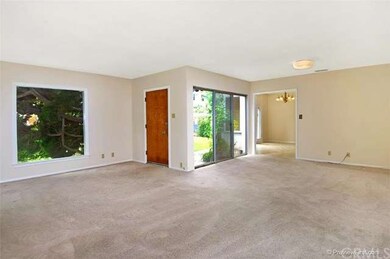
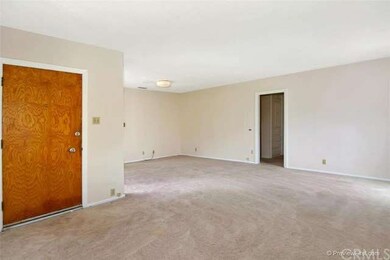
BACK-ON-MARKET subject to cancellation of current escrow. PRICE REDUCED! SUBMIT all reasonable offers! Calling investors -- amazing opportunity in a prime location! This fantastic 2 bedroom + 2 bathroom home is in a PRIME location of Belmont Heights at the corner of Roycroft & Broadway! It has all the character you would expect near the Shore including cove ceilings, arched windows, & charming built-ins. Enclosed by a serene and lush patio and yard, this home has a layout wonderful for entertaining! A short short stroll to all the amenities of 2nd street including dining, shopping, spa treatment, restaurants, bars, coffeehouses, & more ... including close proximity to the beach too! You'll be able to walk everywhere (almost) but there's also a 1-car garage with room to park an additional car in the driveway. Trust Sale. As Is. Seller has never occupied property - buyer to complete all due diligence!
Last Agent to Sell the Property
Beach Equities License #01755588 Listed on: 05/14/2016
| Date | Buyer | Sale Price | Title Company |
|---|---|---|---|
| Weinberg Alana | -- | None Available | |
| Weinberg Amit | -- | None Available | |
| Weinberg Amit | -- | None Available | |
| Ramit Investments Llc | $700,000 | Fatcola | |
| Sanders Vesta Lucile | -- | None Available |
| Date | Status | Borrower | Loan Amount |
|---|---|---|---|
| Previous Owner | Ramit Investments Llc | $665,000 |
| Date | Event | Price | Change | Sq Ft Price |
|---|---|---|---|---|
| 08/26/2016 08/26/16 | Sold | $700,000 | -1.4% | $530 / Sq Ft |
| 08/05/2016 08/05/16 | Pending | -- | -- | -- |
| 07/26/2016 07/26/16 | Price Changed | $710,000 | -11.1% | $538 / Sq Ft |
| 05/31/2016 05/31/16 | For Sale | $799,000 | 0.0% | $605 / Sq Ft |
| 05/31/2016 05/31/16 | Price Changed | $799,000 | -5.9% | $605 / Sq Ft |
| 05/26/2016 05/26/16 | Pending | -- | -- | -- |
| 05/14/2016 05/14/16 | For Sale | $849,000 | -- | $643 / Sq Ft |
| Year | Tax Paid | Tax Assessment Tax Assessment Total Assessment is a certain percentage of the fair market value that is determined by local assessors to be the total taxable value of land and additions on the property. | Land | Improvement |
|---|---|---|---|---|
| 2025 | $14,333 | $1,147,377 | $865,945 | $281,432 |
| 2024 | $14,333 | $1,124,880 | $848,966 | $275,914 |
| 2023 | $14,096 | $1,102,824 | $832,320 | $270,504 |
| 2022 | $13,220 | $1,081,200 | $816,000 | $265,200 |
| 2021 | $9,284 | $750,540 | $600,432 | $150,108 |
| 2020 | $9,260 | $742,845 | $594,276 | $148,569 |
| 2019 | $9,151 | $728,280 | $582,624 | $145,656 |
| 2018 | $8,899 | $714,000 | $571,200 | $142,800 |
| 2016 | $1,174 | $86,603 | $51,336 | $35,267 |
| 2015 | $1,131 | $85,303 | $50,565 | $34,738 |
| 2014 | $1,130 | $83,633 | $49,575 | $34,058 |
Seller's Agent in 2016
Paige Charnick
Beach Equities
(562) 597-8413
3 in this area
87 Total Sales
Buyer's Agent in 2016
Janet Irwin
Compass
(310) 230-5478
2 in this area
25 Total Sales
Source: California Regional Multiple Listing Service (CRMLS)
MLS Number: PW16103291
APN: 7256-020-013
Disclaimer: Certain information contained herein is derived from information provided by parties other than Homes.com. All information provided is deemed reliable, but is not guaranteed to be accurate and should be independently verified.
![]() The multiple listing data appearing on this website, or contained in reports produced therefrom, is owned and copyrighted by California Regional Multiple Listing Service, Inc. ("CRMLS") and is protected by all applicable copyright laws. Information provided is for viewer's personal, non-commercial use and may not be used for any purpose other than to identify prospective properties the viewer may be interested in purchasing. All listing data, including but not limited to square footage and lot size is believed to be accurate, but the listing Agent, listing Broker and CRMLS and its affiliates do not warrant or guarantee such accuracy. The viewer should independently verify the listed data prior to making any decisions based on such information by personal inspection and/or contacting a real estate professional.
The multiple listing data appearing on this website, or contained in reports produced therefrom, is owned and copyrighted by California Regional Multiple Listing Service, Inc. ("CRMLS") and is protected by all applicable copyright laws. Information provided is for viewer's personal, non-commercial use and may not be used for any purpose other than to identify prospective properties the viewer may be interested in purchasing. All listing data, including but not limited to square footage and lot size is believed to be accurate, but the listing Agent, listing Broker and CRMLS and its affiliates do not warrant or guarantee such accuracy. The viewer should independently verify the listed data prior to making any decisions based on such information by personal inspection and/or contacting a real estate professional.
Based on information from California Regional Multiple Listing Service, Inc. and /or other sources. All data, including all measurements and calculations of area, is obtained from various sources and has not been, and will not be, verified by broker or MLS. All information should be independently reviewed and verified for accuracy. Properties may or may not be listed by the office/agent presenting the information