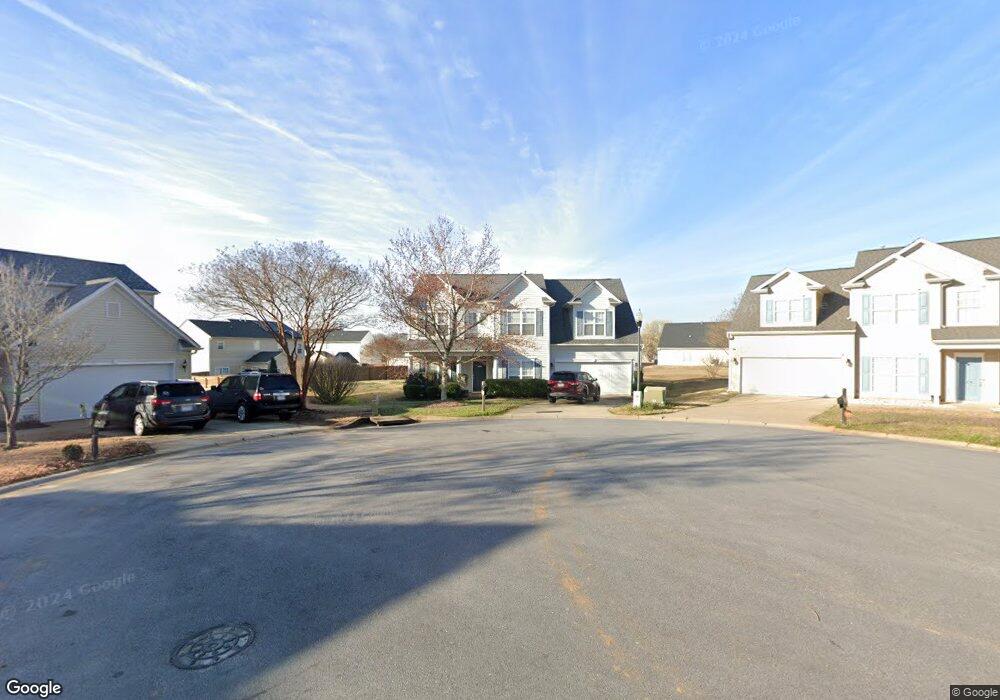
222 S Musgrove Ln Duncan, SC 29334
Estimated Value: $321,000 - $358,000
4
Beds
3
Baths
2,309
Sq Ft
$146/Sq Ft
Est. Value
About This Home
This home is located at 222 S Musgrove Ln, Duncan, SC 29334 and is currently estimated at $337,773, approximately $146 per square foot. 222 S Musgrove Ln is a home located in Spartanburg County with nearby schools including Abner Creek Academy, Byrnes Freshman Academy, and Berry Shoals Intermediate School.
Ownership History
Date
Name
Owned For
Owner Type
Purchase Details
Closed on
Feb 7, 2020
Sold by
Kaska Oliver S
Bought by
Kaska Oliver S and Oliver S Kaska Revocable Trust
Current Estimated Value
Purchase Details
Closed on
Apr 25, 2012
Sold by
Hsbc Bank Usa National Association
Bought by
Kaska Sharen D and Kaska Oliver S
Home Financials for this Owner
Home Financials are based on the most recent Mortgage that was taken out on this home.
Original Mortgage
$111,920
Outstanding Balance
$77,668
Interest Rate
4.01%
Mortgage Type
Future Advance Clause Open End Mortgage
Estimated Equity
$260,105
Purchase Details
Closed on
Feb 22, 2012
Sold by
Canty Kimberly and Canty Kimberly A
Bought by
Hsbc Bank Usa National Association
Purchase Details
Closed on
Sep 2, 2005
Sold by
The Ryland Group Inc
Bought by
Canty Jesse E and Canty Kimberly
Home Financials for this Owner
Home Financials are based on the most recent Mortgage that was taken out on this home.
Original Mortgage
$35,993
Interest Rate
5.77%
Mortgage Type
Stand Alone Second
Create a Home Valuation Report for This Property
The Home Valuation Report is an in-depth analysis detailing your home's value as well as a comparison with similar homes in the area
Home Values in the Area
Average Home Value in this Area
Purchase History
| Date | Buyer | Sale Price | Title Company |
|---|---|---|---|
| Kaska Oliver S | -- | None Available | |
| Kaska Sharen D | $139,900 | -- | |
| Hsbc Bank Usa National Association | $2,500 | -- | |
| Canty Jesse E | $179,967 | -- |
Source: Public Records
Mortgage History
| Date | Status | Borrower | Loan Amount |
|---|---|---|---|
| Open | Kaska Sharen D | $111,920 | |
| Previous Owner | Canty Jesse E | $35,993 | |
| Previous Owner | Canty Jesse E | $143,973 |
Source: Public Records
Tax History Compared to Growth
Tax History
| Year | Tax Paid | Tax Assessment Tax Assessment Total Assessment is a certain percentage of the fair market value that is determined by local assessors to be the total taxable value of land and additions on the property. | Land | Improvement |
|---|---|---|---|---|
| 2025 | $1,494 | $9,500 | $1,364 | $8,136 |
| 2024 | $1,494 | $9,500 | $1,364 | $8,136 |
| 2023 | $1,494 | $9,500 | $1,364 | $8,136 |
| 2022 | $1,351 | $8,261 | $1,039 | $7,222 |
| 2021 | $1,351 | $8,261 | $1,039 | $7,222 |
| 2020 | $1,327 | $8,261 | $1,039 | $7,222 |
| 2019 | $1,323 | $8,261 | $1,039 | $7,222 |
| 2018 | $1,264 | $8,261 | $1,039 | $7,222 |
| 2017 | $1,091 | $7,184 | $1,040 | $6,144 |
| 2016 | $1,052 | $7,184 | $1,040 | $6,144 |
| 2015 | $1,023 | $7,184 | $1,040 | $6,144 |
| 2014 | $1,026 | $7,184 | $1,040 | $6,144 |
Source: Public Records
Map
Nearby Homes
- 253 Golden Bear Walk
- 1011 Rogers Bridge Rd
- 408 Royalston Ct
- 624 S Morningwood Ln
- 737 Stilmore Dr
- 1055 Summerlin Trail
- 638 Grantleigh Dr
- 254 Twilitemist Dr
- 3048 Olivette Place
- 3052 Olivette Place
- 3025 Olivette Place
- 800 Redmill Ln
- 820 Redmill Ln
- 1312 Duncan Reidville Rd
- 636 Sunwater Dr
- 141 Agnes Dr
- 147 Bearden Dr
- 644 Diamond Ridge Way
- 159 Rockingham Rd
- 167 Rockingham Rd
- 214 S Musgrove Ln
- 775 Thistlewood Dr
- 225 S Musgrove Ln
- 557 Smoothstone Dr
- 553 Smoothstone Dr
- 561 Smoothstone Dr
- 210 S Musgrove Ln
- 776 Thistlewood Dr
- 549 Smoothstone Dr
- 565 Smoothstone Dr
- 217 S Musgrove Ln
- 213 S Musgrove Ln
- 312 Nightshade Ln
- 316 Nightshade Ln
- 545 Smoothstone Dr
- 765 Thistlewood Dr
- 209 S Musgrove Ln
- 774 Thistlewood Dr
- 308 Nightshade Ln
- 604 Addlestone Way