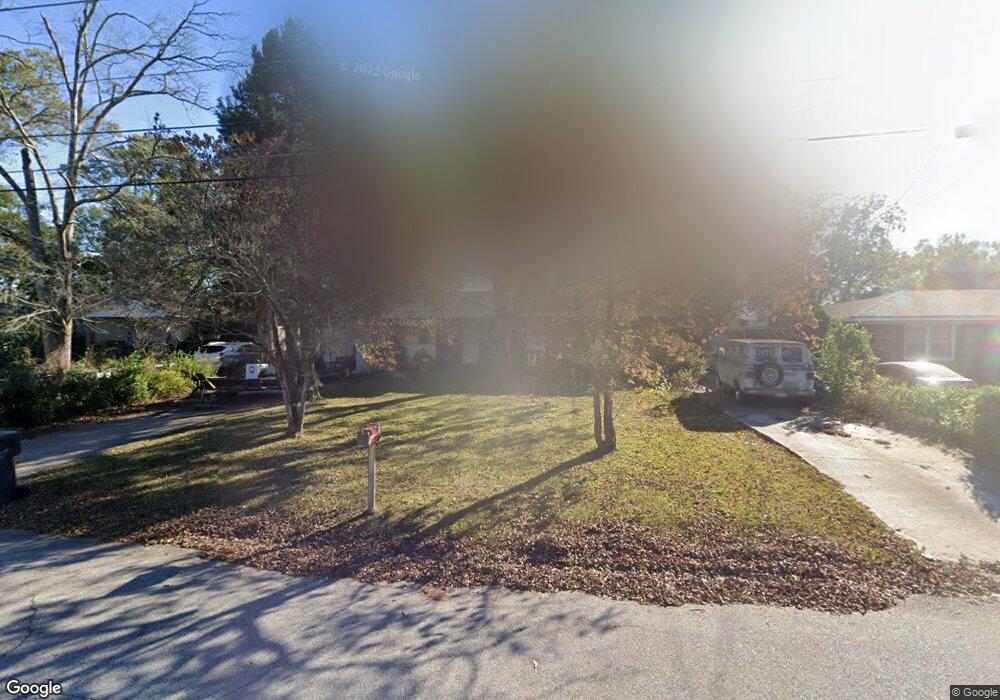
2220 Richards Rd Augusta, GA 30906
Richmond Hill NeighborhoodEstimated Value: $101,000 - $134,000
3
Beds
2
Baths
1,032
Sq Ft
$114/Sq Ft
Est. Value
About This Home
This home is located at 2220 Richards Rd, Augusta, GA 30906 and is currently estimated at $117,614, approximately $113 per square foot. 2220 Richards Rd is a home located in Richmond County with nearby schools including Richmond Hill K-8, Johnson Magnet, and Butler High School.
Ownership History
Date
Name
Owned For
Owner Type
Purchase Details
Closed on
Jan 10, 2019
Sold by
Hollins Charles E
Bought by
Hollins Jess and Hollins Angela
Current Estimated Value
Home Financials for this Owner
Home Financials are based on the most recent Mortgage that was taken out on this home.
Original Mortgage
$40,000
Outstanding Balance
$24,702
Interest Rate
4.6%
Mortgage Type
New Conventional
Estimated Equity
$92,912
Purchase Details
Closed on
Mar 9, 2001
Sold by
Newman Michael V and Newman Jacqueline R
Bought by
Hollins Charles E
Home Financials for this Owner
Home Financials are based on the most recent Mortgage that was taken out on this home.
Original Mortgage
$54,150
Interest Rate
7.12%
Mortgage Type
FHA
Purchase Details
Closed on
Dec 5, 2000
Sold by
Newman David M and Federal National Mortgage Asso
Bought by
Newman Michael V and Newman Jacqueline R
Purchase Details
Closed on
Jan 31, 1996
Sold by
Newman Michael Val
Bought by
Newman David M
Create a Home Valuation Report for This Property
The Home Valuation Report is an in-depth analysis detailing your home's value as well as a comparison with similar homes in the area
Home Values in the Area
Average Home Value in this Area
Purchase History
| Date | Buyer | Sale Price | Title Company |
|---|---|---|---|
| Hollins Jess | $50,000 | -- | |
| Hollins Charles E | $55,000 | -- | |
| Newman Michael V | $46,500 | -- | |
| Newman Michael V | $46,500 | -- | |
| Newman David M | $57,000 | -- |
Source: Public Records
Mortgage History
| Date | Status | Borrower | Loan Amount |
|---|---|---|---|
| Open | Hollins Jess | $40,000 | |
| Previous Owner | Hollins Charles E | $54,150 |
Source: Public Records
Tax History
| Year | Tax Paid | Tax Assessment Tax Assessment Total Assessment is a certain percentage of the fair market value that is determined by local assessors to be the total taxable value of land and additions on the property. | Land | Improvement |
|---|---|---|---|---|
| 2025 | $1,483 | $42,720 | $5,600 | $37,120 |
| 2024 | $1,483 | $48,528 | $5,600 | $42,928 |
| 2023 | $952 | $44,744 | $5,600 | $39,144 |
| 2022 | $1,416 | $41,425 | $5,600 | $35,825 |
| 2021 | $1,135 | $29,050 | $5,600 | $23,450 |
| 2020 | $1,121 | $29,050 | $5,600 | $23,450 |
| 2019 | $1,335 | $29,050 | $5,600 | $23,450 |
| 2018 | $1,328 | $28,577 | $5,600 | $22,977 |
| 2017 | $1,268 | $28,577 | $5,600 | $22,977 |
| 2016 | $1,269 | $28,577 | $5,600 | $22,977 |
| 2015 | $1,277 | $28,577 | $5,600 | $22,977 |
| 2014 | $1,221 | $26,826 | $5,600 | $21,226 |
Source: Public Records
Map
Nearby Homes
- 2810 Anne St
- 2808 Richmond Hill Rd
- 2804 Jordan St
- 2816 King St
- 2702 Richmond Hill Rd
- 2225 Martin Rd
- 2232 Bandler Rd
- 2366 Ruby Dr
- 2820 Richmond Hill Rd
- 2205 Bandler Rd
- 2537 Sandra Dr
- 2381 Franklin St
- 2204 Sandra Ct
- 2560 Kaufman Dr
- 2411 Ruby Dr
- 2413 Ruby Dr
- 2148 Eastside Ct
- 2146 Eastside Ct
- 2434 Young Dr
- 2531 Norton Blvd
- 2222 Richards Rd
- 2218 Richards Rd
- 2216 Richards Rd
- 2223 Ruby Dr
- 2224 Richards Rd
- 2225 Ruby Dr
- 2219 Ruby Dr
- 2225 Richards Rd
- 2223 Richards Rd
- 2227 Richards Rd
- 2226 Richards Rd
- 2221 Richards Rd
- 2229 Richards Rd
- 2214 Richards Rd
- 2228 Richards Rd
- 2231 Richards Rd
- 2802 King St
- 2212 Richards Rd
- 2219 Richards Rd
- 2801 Anne St
Your Personal Tour Guide
Ask me questions while you tour the home.