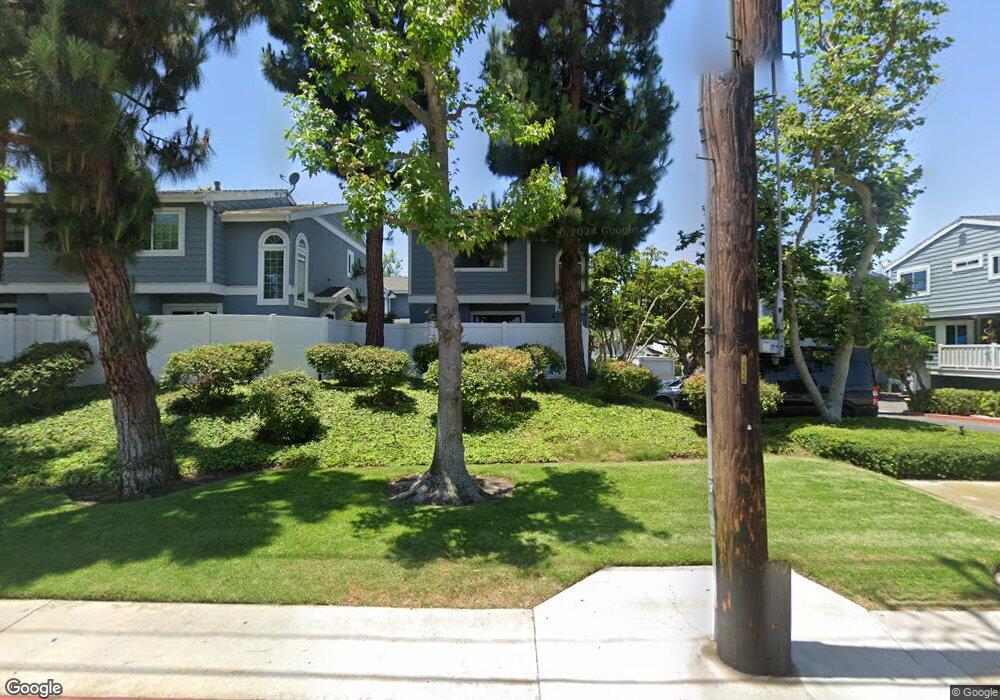
2221 Mayfair Ct Costa Mesa, CA 92627
Estimated Value: $881,705 - $1,118,000
3
Beds
3
Baths
1,436
Sq Ft
$670/Sq Ft
Est. Value
About This Home
This home is located at 2221 Mayfair Ct, Costa Mesa, CA 92627 and is currently estimated at $962,176, approximately $670 per square foot. 2221 Mayfair Ct is a home located in Orange County with nearby schools including College Park Elementary School, Costa Mesa High School, and Page Academy.
Ownership History
Date
Name
Owned For
Owner Type
Purchase Details
Closed on
Mar 19, 2013
Sold by
Rosenberg Ashley and Boothe Ashley
Bought by
Boothe Ashley and Boothe Brian
Current Estimated Value
Purchase Details
Closed on
Feb 18, 2010
Sold by
Schofield Shannon
Bought by
Rosenberg Ashley and Boothe Brian
Home Financials for this Owner
Home Financials are based on the most recent Mortgage that was taken out on this home.
Original Mortgage
$320,000
Outstanding Balance
$211,468
Interest Rate
5%
Mortgage Type
New Conventional
Estimated Equity
$750,708
Purchase Details
Closed on
Oct 13, 2005
Sold by
Schofield Nicholas
Bought by
Schofield Shannon
Purchase Details
Closed on
Mar 1, 1999
Sold by
Johnson Edwin V
Bought by
Schofield Nicholas and Schofield Shannon
Home Financials for this Owner
Home Financials are based on the most recent Mortgage that was taken out on this home.
Original Mortgage
$165,000
Interest Rate
6.79%
Create a Home Valuation Report for This Property
The Home Valuation Report is an in-depth analysis detailing your home's value as well as a comparison with similar homes in the area
Purchase History
| Date | Buyer | Sale Price | Title Company |
|---|---|---|---|
| Boothe Ashley | -- | Orange Coast Title | |
| Rosenberg Ashley | $410,000 | Lawyers Title | |
| Schofield Shannon | $46,000 | None Available | |
| Schofield Nicholas | $215,000 | Lawyers Title Company | |
| Schofield Nicholas | $215,000 | Lawyers Title Company |
Source: Public Records
Mortgage History
| Date | Status | Borrower | Loan Amount |
|---|---|---|---|
| Open | Rosenberg Ashley | $320,000 | |
| Previous Owner | Schofield Nicholas | $165,000 |
Source: Public Records
Tax History
| Year | Tax Paid | Tax Assessment Tax Assessment Total Assessment is a certain percentage of the fair market value that is determined by local assessors to be the total taxable value of land and additions on the property. | Land | Improvement |
|---|---|---|---|---|
| 2025 | $6,140 | $528,969 | $374,197 | $154,772 |
| 2024 | $6,140 | $518,598 | $366,860 | $151,738 |
| 2023 | $5,960 | $508,430 | $359,667 | $148,763 |
| 2022 | $5,763 | $498,461 | $352,614 | $145,847 |
| 2021 | $5,598 | $488,688 | $345,700 | $142,988 |
| 2020 | $5,545 | $483,678 | $342,156 | $141,522 |
| 2019 | $5,438 | $474,195 | $335,447 | $138,748 |
| 2018 | $5,334 | $464,898 | $328,870 | $136,028 |
| 2017 | $5,242 | $455,783 | $322,422 | $133,361 |
| 2016 | $5,128 | $446,847 | $316,100 | $130,747 |
| 2015 | $5,077 | $440,135 | $311,351 | $128,784 |
| 2014 | $4,958 | $431,514 | $305,252 | $126,262 |
Source: Public Records
Map
Nearby Homes
- 2234 Avalon St
- 2214 Rutgers Dr
- 327 W Wilson St Unit 107
- 327 W Wilson St Unit 88
- 327 W Wilson St Unit 86
- 2338 Bunker Hill Way
- 158 Cecil Place
- 168 23rd St Unit D
- 2330 Vanguard Way Unit F102
- 157 Yorktown Ln
- 2404 Niagara Way
- 107 Yorktown Ln
- 380 W Wilson St Unit B103
- 2408 Saratoga Way
- 2408 Minuteman Way
- 2383 Orange Ave
- 2400 Elden Ave Unit 12
- 135 Morristown Ln
- 409 Bryson Springs
- 421 Bryson Springs
- 2219 Mayfair Ct
- 2217 Mayfair Ct
- 2220 Mayfair Ct
- 205 Mayfair Ln
- 2222 Saybrook Ln
- 207 Mayfair Ln Unit 86
- 207 Mayfair Ln
- 2215 Saybrook Ln
- 2216 Mayfair Ct
- 2224 Saybrook Ln
- 209 Mayfair Ln
- 2214 Mayfair Ct
- 203 Mayfair Ln
- 2226 Saybrook Ln
- 2217 Saybrook Ln
- 210 Saybrook Ct
- 2228 Saybrook Ln
- 201 Mayfair Ln
- 212 Saybrook Ct
- 206 Mayfair Ln
Your Personal Tour Guide
Ask me questions while you tour the home.