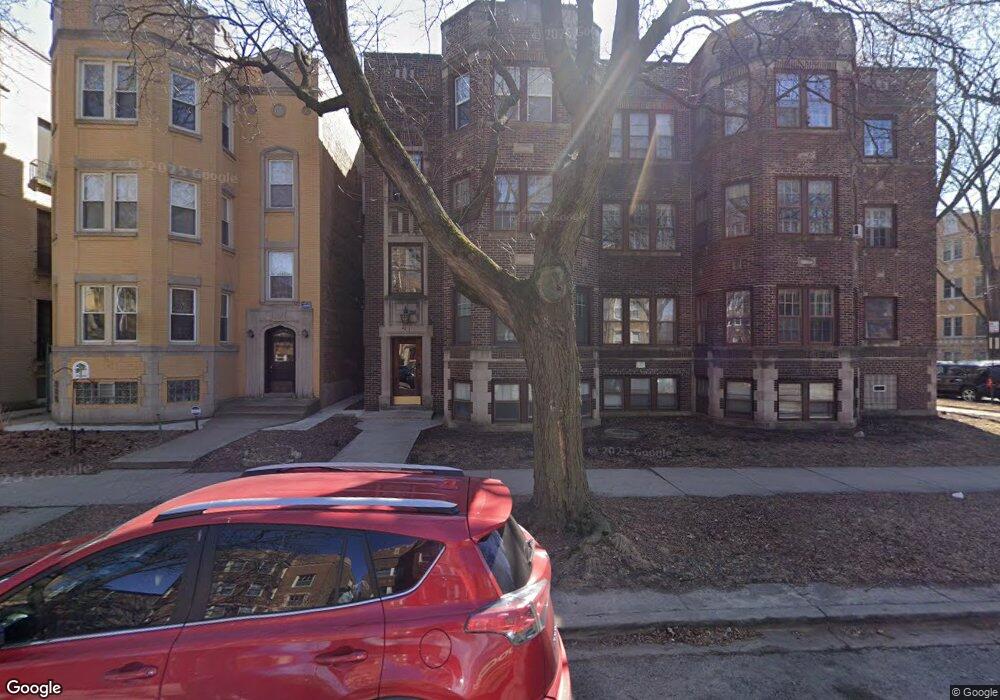
2221 W Arthur Ave Unit 64491 Chicago, IL 60645
West Ridge NeighborhoodEstimated Value: $148,000 - $193,000
1
Bed
1
Bath
800
Sq Ft
$204/Sq Ft
Est. Value
About This Home
This home is located at 2221 W Arthur Ave Unit 64491, Chicago, IL 60645 and is currently estimated at $163,052, approximately $203 per square foot. 2221 W Arthur Ave Unit 64491 is a home located in Cook County with nearby schools including George Armstrong Elementary School, Senn High School, and God's Battle Axe Prayer Academy.
Ownership History
Date
Name
Owned For
Owner Type
Purchase Details
Closed on
Sep 8, 2023
Sold by
Mirza Muhammad Umer
Bought by
Shahid Iqbal Syed
Current Estimated Value
Purchase Details
Closed on
Apr 20, 2022
Sold by
Mirza Farrukh and Mirza Y
Bought by
Mirza Muhammad Umer and Mirza Y
Purchase Details
Closed on
Apr 14, 2022
Sold by
Mirza Farrukh and Mirza Y
Bought by
Mirza Muhammad Umer and Mirza Y
Purchase Details
Closed on
Feb 11, 2021
Sold by
Vileeanuof Nicolae and Vilceanu Marjoara
Bought by
Mirza Farrukh
Purchase Details
Closed on
Aug 30, 2001
Sold by
Bronson James L and Bronson Shirley J
Bought by
Vilceanu Nicolae and Vilceanu Marioara
Home Financials for this Owner
Home Financials are based on the most recent Mortgage that was taken out on this home.
Original Mortgage
$64,000
Interest Rate
7.03%
Mortgage Type
Purchase Money Mortgage
Create a Home Valuation Report for This Property
The Home Valuation Report is an in-depth analysis detailing your home's value as well as a comparison with similar homes in the area
Home Values in the Area
Average Home Value in this Area
Purchase History
| Date | Buyer | Sale Price | Title Company |
|---|---|---|---|
| Shahid Iqbal Syed | $80,000 | None Listed On Document | |
| Mirza Muhammad Umer | -- | -- | |
| Mirza Muhammad Umer | -- | None Listed On Document | |
| Mirza Farrukh | $107,000 | Affinity Title | |
| Vilceanu Nicolae | $80,000 | -- |
Source: Public Records
Mortgage History
| Date | Status | Borrower | Loan Amount |
|---|---|---|---|
| Previous Owner | Vilceanu Nicolae | $64,000 |
Source: Public Records
Tax History Compared to Growth
Tax History
| Year | Tax Paid | Tax Assessment Tax Assessment Total Assessment is a certain percentage of the fair market value that is determined by local assessors to be the total taxable value of land and additions on the property. | Land | Improvement |
|---|---|---|---|---|
| 2024 | $1,266 | $11,103 | $1,160 | $9,943 |
| 2023 | $1,234 | $6,000 | $928 | $5,072 |
| 2022 | $1,234 | $6,000 | $928 | $5,072 |
| 2021 | $537 | $5,999 | $928 | $5,071 |
| 2020 | $98 | $3,541 | $876 | $2,665 |
| 2019 | $100 | $3,929 | $876 | $3,053 |
| 2018 | $98 | $3,929 | $876 | $3,053 |
| 2017 | $222 | $4,407 | $773 | $3,634 |
| 2016 | $383 | $4,407 | $773 | $3,634 |
| 2015 | $327 | $4,407 | $773 | $3,634 |
| 2014 | $547 | $5,519 | $696 | $4,823 |
| 2013 | $526 | $5,519 | $696 | $4,823 |
Source: Public Records
Map
Nearby Homes
- 2111 W Arthur Ave Unit 1S
- 6414 N Hoyne Ave Unit 3W
- 2205 W Highland Ave Unit 2N
- 6318 N Bell Ave
- 2320 W Rosemont Ave Unit 1
- 6423 N Seeley Ave
- 6246 N Oakley Ave
- 2218 W Thome Ave Unit 3N
- 6561 N Seeley Ave
- 6609 N Artesian Ave
- 6319 N Artesian Ave Unit 3W
- 6433 N Damen Ave Unit 3E
- 6431 N Damen Ave Unit 2E
- 2300 W Granville Ave Unit G
- 2338 W Granville Ave Unit 2
- 6500 N Ridge Blvd Unit 4E
- 6400 N Ridge Blvd Unit 203
- 2217 W Farwell Ave Unit 3B
- 2217 W Farwell Ave Unit 2B
- 2241 W Farwell Ave Unit 2D
- 2221 W Arthur Ave Unit 2
- 2221 W Arthur Ave Unit 22211
- 2221 W Arthur Ave Unit 22212
- 2221 W Arthur Ave Unit 22213
- 2221 W Arthur Ave Unit 2W
- 2221 W Arthur Ave
- 2221 W Arthur Ave Unit 3
- 2221 W Arthur Ave Unit 1
- 2223 W Arthur Ave Unit 6457-2
- 6451 N Bell Ave Unit 64511
- 6451 N Bell Ave Unit 64512
- 6449 N Bell Ave Unit 64493
- 6449 N Bell Ave Unit 64492
- 6449 N Bell Ave Unit 3S
- 6449 N Bell Ave Unit 2
- 6449 N Bell Ave Unit 1
- 6455 N Bell Ave Unit 64553
- 6455 N Bell Ave Unit 64552
- 6455 N Bell Ave Unit 64551
- 6455 N Bell Ave Unit 1