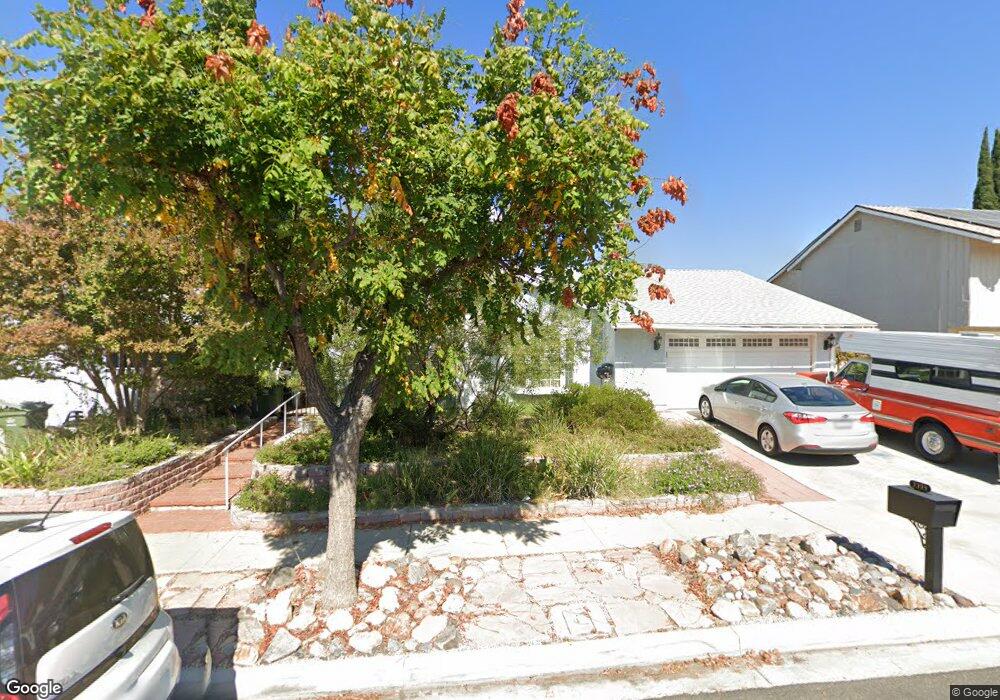
2223 Burnside St Simi Valley, CA 93065
Central Simi Valley NeighborhoodEstimated Value: $785,632 - $927,000
4
Beds
2
Baths
2,015
Sq Ft
$425/Sq Ft
Est. Value
About This Home
This home is located at 2223 Burnside St, Simi Valley, CA 93065 and is currently estimated at $855,908, approximately $424 per square foot. 2223 Burnside St is a home located in Ventura County with nearby schools including Park View Elementary School, Hillside Middle School, and Royal High School.
Ownership History
Date
Name
Owned For
Owner Type
Purchase Details
Closed on
May 24, 2007
Sold by
Deshong Steven G and De Shong Susan
Bought by
Deshong Steven G and Deshong Susan
Current Estimated Value
Purchase Details
Closed on
Sep 5, 2002
Sold by
Almanza Audrey
Bought by
Tripp Brian T
Home Financials for this Owner
Home Financials are based on the most recent Mortgage that was taken out on this home.
Original Mortgage
$254,000
Outstanding Balance
$106,095
Interest Rate
6.37%
Estimated Equity
$749,813
Purchase Details
Closed on
Aug 8, 2002
Sold by
Tripp Brian T and Tripp Linda J
Bought by
Deshong Steven G and Deshong Susan
Home Financials for this Owner
Home Financials are based on the most recent Mortgage that was taken out on this home.
Original Mortgage
$254,000
Outstanding Balance
$106,095
Interest Rate
6.37%
Estimated Equity
$749,813
Create a Home Valuation Report for This Property
The Home Valuation Report is an in-depth analysis detailing your home's value as well as a comparison with similar homes in the area
Home Values in the Area
Average Home Value in this Area
Purchase History
| Date | Buyer | Sale Price | Title Company |
|---|---|---|---|
| Deshong Steven G | -- | None Available | |
| Tripp Brian T | -- | Stewart Title Company | |
| Deshong Steven G | $365,000 | Stewart Title Company |
Source: Public Records
Mortgage History
| Date | Status | Borrower | Loan Amount |
|---|---|---|---|
| Open | Deshong Steven G | $254,000 |
Source: Public Records
Tax History
| Year | Tax Paid | Tax Assessment Tax Assessment Total Assessment is a certain percentage of the fair market value that is determined by local assessors to be the total taxable value of land and additions on the property. | Land | Improvement |
|---|---|---|---|---|
| 2025 | $6,492 | $528,612 | $211,440 | $317,172 |
| 2024 | $6,492 | $518,248 | $207,295 | $310,953 |
| 2023 | $6,105 | $508,087 | $203,231 | $304,856 |
| 2022 | $6,085 | $498,125 | $199,246 | $298,879 |
| 2021 | $6,044 | $488,358 | $195,339 | $293,019 |
| 2020 | $5,921 | $483,352 | $193,337 | $290,015 |
| 2019 | $5,653 | $473,876 | $189,547 | $284,329 |
| 2018 | $5,608 | $464,585 | $185,831 | $278,754 |
| 2017 | $5,486 | $455,477 | $182,188 | $273,289 |
| 2016 | $5,241 | $446,547 | $178,616 | $267,931 |
| 2015 | $5,133 | $439,841 | $175,934 | $263,907 |
| 2014 | $5,064 | $431,228 | $172,489 | $258,739 |
Source: Public Records
Map
Nearby Homes
- 2146 N Brower St
- 2371 Larch St
- 2399 Lee St
- 2405 Lee St
- 2239 McDonald St
- 1843 Garvin Ave
- 2357 Lawnview Ct
- 2091 Marter Ave
- 2385 N Justin Ave
- 1558 Ysrella Ave
- 2165 Malcolm St
- 2267 Morley St
- 2325 Wisteria St
- 1805 Hillary Ct
- 1904 Heywood St Unit L
- 2095 Morley St
- 1932 Heywood St Unit B
- 2235 Clover St
- 2407 Elizondo Ave
- 1387 Cherry Ave
- 2235 Burnside St
- 2219 Burnside St
- 2216 Knollhaven St
- 2204 Knollhaven St
- 2228 Knollhaven St
- 2222 Burnside St
- 2236 Knollhaven St
- 2234 Burnside St
- 2218 Burnside St
- 2253 Burnside St
- 2240 Burnside St
- 2077 N Justin Ave
- 2093 N Justin Ave
- 2248 Knollhaven St
- 2061 N Justin Ave
- 2103 N Justin Ave
- 2252 Burnside St
- 2045 N Justin Ave
- 2267 Burnside St
- 2217 Knollhaven St
Your Personal Tour Guide
Ask me questions while you tour the home.