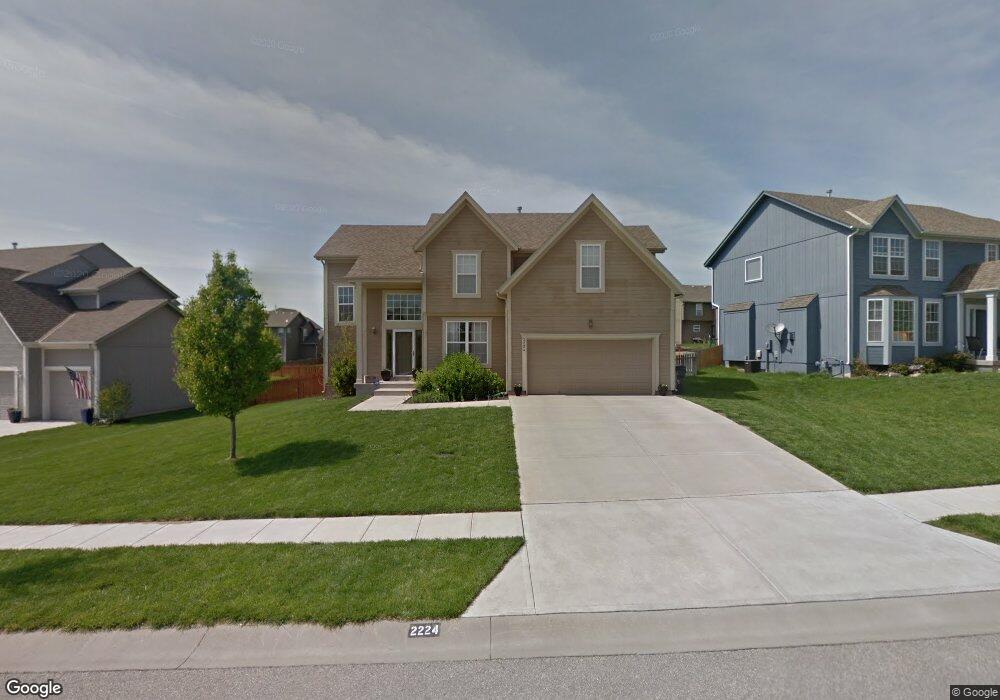
2224 W Elm St Olathe, KS 66061
Estimated Value: $520,215 - $561,000
4
Beds
4
Baths
2,565
Sq Ft
$209/Sq Ft
Est. Value
About This Home
This home is located at 2224 W Elm St, Olathe, KS 66061 and is currently estimated at $534,804, approximately $208 per square foot. 2224 W Elm St is a home located in Johnson County with nearby schools including Clearwater Creek Elementary School, Oregon Trail Middle School, and Olathe West High School.
Ownership History
Date
Name
Owned For
Owner Type
Purchase Details
Closed on
Jul 24, 2013
Sold by
Prairie Farms Homes Llc
Bought by
Buenger Brian L and Buenger Kimberly A
Current Estimated Value
Purchase Details
Closed on
Jul 7, 2008
Sold by
Premier Homes Inc
Bought by
Bollinger Chris and Bollinger Kari
Home Financials for this Owner
Home Financials are based on the most recent Mortgage that was taken out on this home.
Original Mortgage
$220,455
Interest Rate
6.4%
Mortgage Type
New Conventional
Purchase Details
Closed on
May 26, 2006
Sold by
Prairie Center Development L L C
Bought by
Premier Homes Inc
Home Financials for this Owner
Home Financials are based on the most recent Mortgage that was taken out on this home.
Original Mortgage
$220,000
Interest Rate
6.63%
Mortgage Type
Construction
Create a Home Valuation Report for This Property
The Home Valuation Report is an in-depth analysis detailing your home's value as well as a comparison with similar homes in the area
Home Values in the Area
Average Home Value in this Area
Purchase History
| Date | Buyer | Sale Price | Title Company |
|---|---|---|---|
| Buenger Brian L | -- | Thompson Affinity Title Llc | |
| Bollinger Chris | -- | Kansas City Title | |
| Premier Homes Inc | -- | Commonwealth Land Title Insu |
Source: Public Records
Mortgage History
| Date | Status | Borrower | Loan Amount |
|---|---|---|---|
| Previous Owner | Bollinger Chris | $220,455 | |
| Previous Owner | Premier Homes Inc | $220,000 |
Source: Public Records
Tax History Compared to Growth
Tax History
| Year | Tax Paid | Tax Assessment Tax Assessment Total Assessment is a certain percentage of the fair market value that is determined by local assessors to be the total taxable value of land and additions on the property. | Land | Improvement |
|---|---|---|---|---|
| 2024 | $5,925 | $52,359 | $11,554 | $40,805 |
| 2023 | $5,753 | $49,990 | $9,632 | $40,358 |
| 2022 | $5,252 | $44,413 | $8,754 | $35,659 |
| 2021 | $5,055 | $40,802 | $8,754 | $32,048 |
| 2020 | $5,064 | $40,503 | $8,754 | $31,749 |
| 2019 | $5,037 | $40,020 | $8,754 | $31,266 |
| 2018 | $5,060 | $39,905 | $7,963 | $31,942 |
| 2017 | $4,790 | $37,398 | $7,963 | $29,435 |
| 2016 | $4,332 | $34,707 | $5,840 | $28,867 |
| 2015 | $4,152 | $33,293 | $5,840 | $27,453 |
| 2013 | -- | $29,520 | $5,308 | $24,212 |
Source: Public Records
Map
Nearby Homes
- 2427 W Fredrickson Dr
- 2237 W Concord Dr
- 119 S Diane Dr
- 115 S Diane Dr
- 109 S Diane Dr
- 105 S Diane Dr
- 2295 W Dartmouth St
- 2291 W Dartmouth St
- 2255 W Dartmouth St
- 2251 W Dartmouth St
- 2607 W Park St
- 2651 W Park St
- 2673 W Park St
- 2717 W Park St
- 2682 W Park St
- 2739 W Park St
- 2696 W Park St
- 2761 W Park St
- 2740 W Park St
- 281 S Singletree St
- 2192 W Elm St
- 2254 W Elm St
- 334 S Stonecrest Rd
- 2182 W Elm St
- 2284 W Elm St
- 342 S Stonecrest Rd
- 2215 W Elm St
- 2235 W Elm St
- 326 S Stonecrest Rd
- 2193 W Elm St
- 2255 W Elm St
- 350 S Stonecrest Rd
- 2172 W Elm St
- 2316 W Elm St
- 2183 W Elm St
- 2285 W Elm St
- 320 S Stonecrest Rd
- 2173 W Elm St
- 362 S Stonecrest Rd
- 2152 W Elm St