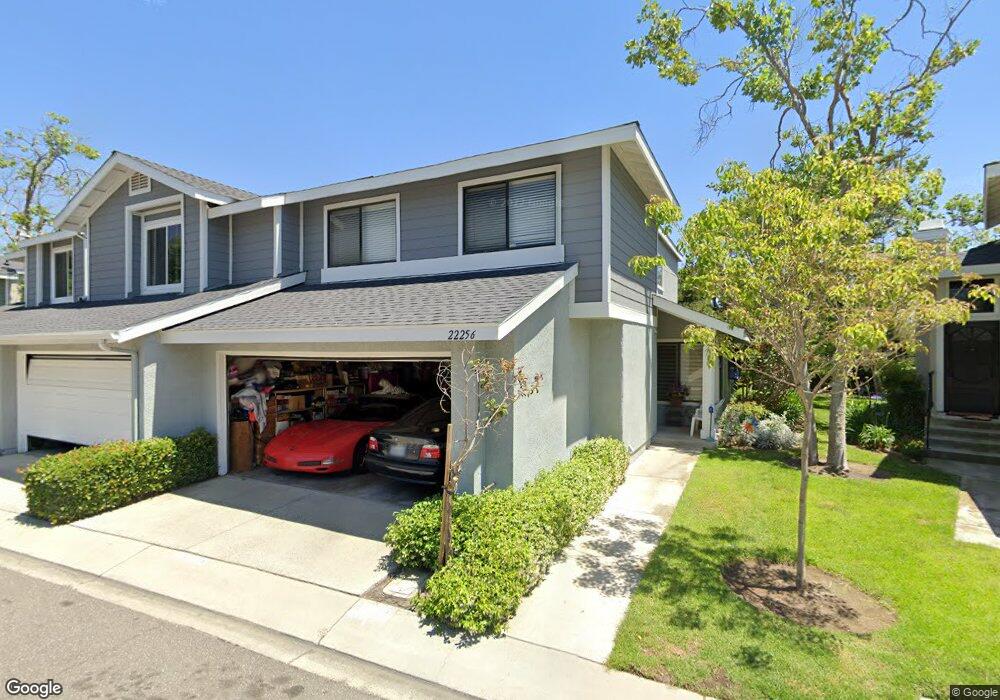
22256 Summit Hill Dr Unit 5 Lake Forest, CA 92630
Estimated Value: $814,000 - $883,000
3
Beds
2
Baths
1,620
Sq Ft
$529/Sq Ft
Est. Value
About This Home
This home is located at 22256 Summit Hill Dr Unit 5, Lake Forest, CA 92630 and is currently estimated at $856,221, approximately $528 per square foot. 22256 Summit Hill Dr Unit 5 is a home located in Orange County with nearby schools including Lake Forest Elementary School, Serrano Intermediate School, and El Toro High School.
Ownership History
Date
Name
Owned For
Owner Type
Purchase Details
Closed on
Nov 20, 2020
Sold by
Gantt Mona L
Bought by
Gantt Mona L and Mona L Gantt Trust
Current Estimated Value
Home Financials for this Owner
Home Financials are based on the most recent Mortgage that was taken out on this home.
Original Mortgage
$892,500
Outstanding Balance
$863,217
Interest Rate
2.33%
Mortgage Type
Reverse Mortgage Home Equity Conversion Mortgage
Estimated Equity
-$6,996
Purchase Details
Closed on
Mar 17, 2017
Sold by
Gantt Mona L
Bought by
Gantt Mona L
Purchase Details
Closed on
Feb 13, 2004
Sold by
Gantt Mona L
Bought by
Gantt Mona L and The Mona L Gantt Trust
Purchase Details
Closed on
Feb 22, 1994
Sold by
Sugarman James H
Bought by
Gantt Mona L
Home Financials for this Owner
Home Financials are based on the most recent Mortgage that was taken out on this home.
Original Mortgage
$136,000
Interest Rate
4.25%
Create a Home Valuation Report for This Property
The Home Valuation Report is an in-depth analysis detailing your home's value as well as a comparison with similar homes in the area
Home Values in the Area
Average Home Value in this Area
Purchase History
| Date | Buyer | Sale Price | Title Company |
|---|---|---|---|
| Gantt Mona L | -- | Fnc Title Of California | |
| Gantt Mona L | -- | None Available | |
| Gantt Mona L | -- | -- | |
| Gantt Mona L | $170,000 | Continental Lawyers Title Co |
Source: Public Records
Mortgage History
| Date | Status | Borrower | Loan Amount |
|---|---|---|---|
| Open | Gantt Mona L | $892,500 | |
| Closed | Gantt Mona L | $136,000 |
Source: Public Records
Tax History Compared to Growth
Tax History
| Year | Tax Paid | Tax Assessment Tax Assessment Total Assessment is a certain percentage of the fair market value that is determined by local assessors to be the total taxable value of land and additions on the property. | Land | Improvement |
|---|---|---|---|---|
| 2025 | $2,878 | $288,934 | $77,681 | $211,253 |
| 2024 | $2,878 | $283,269 | $76,158 | $207,111 |
| 2023 | $2,809 | $277,715 | $74,665 | $203,050 |
| 2022 | $2,757 | $272,270 | $73,201 | $199,069 |
| 2021 | $2,701 | $266,932 | $71,766 | $195,166 |
| 2020 | $2,676 | $264,195 | $71,030 | $193,165 |
| 2019 | $2,622 | $259,015 | $69,637 | $189,378 |
| 2018 | $2,571 | $253,937 | $68,272 | $185,665 |
| 2017 | $2,519 | $248,958 | $66,933 | $182,025 |
| 2016 | $2,476 | $244,077 | $65,621 | $178,456 |
| 2015 | $2,445 | $240,411 | $64,635 | $175,776 |
| 2014 | $2,391 | $235,702 | $63,369 | $172,333 |
Source: Public Records
Map
Nearby Homes
- 26445 Sandy Creek
- 22421 Rippling Brook
- 22322 Silent Brook
- 22292 Silent Brook
- 25885 Trabuco Rd Unit 41
- 25885 Trabuco Rd Unit 91
- 25885 Trabuco Rd Unit 206
- 25885 Trabuco Rd Unit 226
- 25885 Trabuco Rd Unit 33
- 25885 Trabuco Rd Unit 306
- 26262 Hesby Way
- 26242 Brookhollow
- 22201 Center Pointe Unit 2D
- 25712 Le Parc Unit 7
- 25761 Le Parc Unit 82
- 25761 Le Parc Unit 89
- 25671 Le Parc Unit 85
- 25671 Le Parc Unit 82
- 22081 Broken Bow Dr
- 25644 Mont Pointe Unit 1A
- 22254 Summit Hill Dr Unit 6
- 22262 Summit Hill Dr Unit 4
- 22252 Summit Hill Dr Unit 7
- 22266 Summit Hill Dr Unit 3
- 22272 Summit Hill Dr Unit 2
- 22248 Summit Hill Dr Unit 8
- 22248 Summit Hill Dr
- 22276 Summit Hill Dr
- 22246 Summit Hill Dr
- 26367 W Grove Cir
- 26367 W Grove Cir Unit 60
- 26367 W Grove Cir
- 22282 Summit Hill Dr Unit 47
- 22244 Summit Hill Dr Unit 10
- 26368 W Grove Cir Unit 61
- 26365 W Grove Cir Unit 59
- 22286 Summit Hill Dr Unit 46
- 22242 Summit Hill Dr Unit 11
- 26363 W Grove Cir
- 26366 W Grove Cir Unit 62