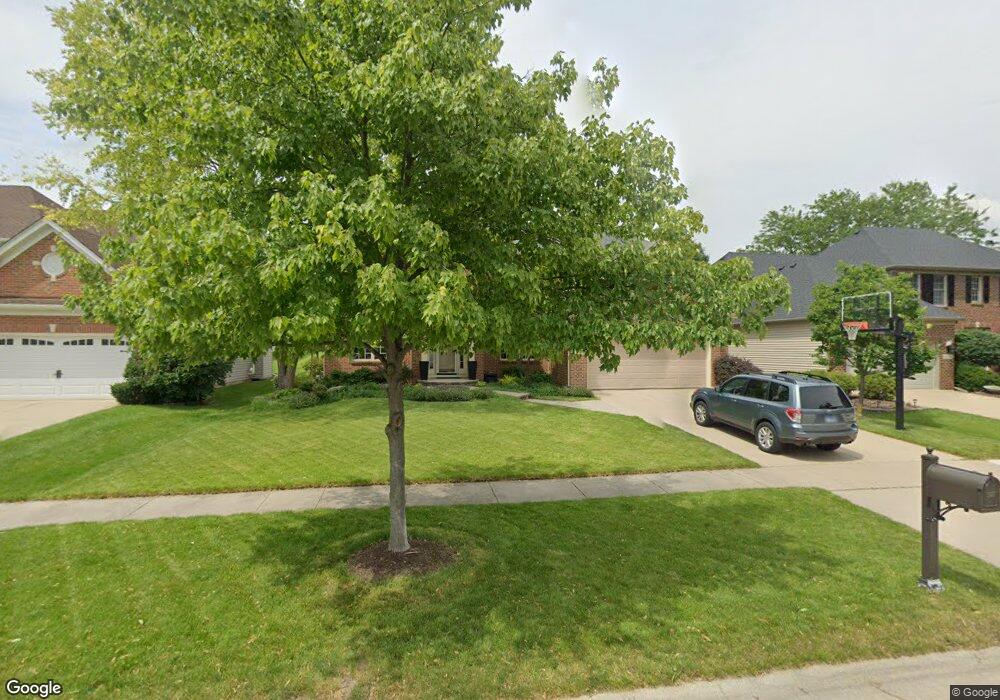
2227 Haider Ave Naperville, IL 60564
Clow Creek NeighborhoodEstimated Value: $627,360 - $850,000
--
Bed
1
Bath
2,971
Sq Ft
$240/Sq Ft
Est. Value
About This Home
This home is located at 2227 Haider Ave, Naperville, IL 60564 and is currently estimated at $713,840, approximately $240 per square foot. 2227 Haider Ave is a home located in Will County with nearby schools including Oliver Julian Kendall Elementary School, Ellsworth Elementary School, and Clifford Crone Middle School.
Ownership History
Date
Name
Owned For
Owner Type
Purchase Details
Closed on
Dec 11, 2020
Sold by
Sexton Amy J
Bought by
Sexton Amy J and Amy J Sexton Trust
Current Estimated Value
Purchase Details
Closed on
Oct 26, 1998
Sold by
Blake Builders Inc
Bought by
Sexton Sean T and Sexton Amy J
Home Financials for this Owner
Home Financials are based on the most recent Mortgage that was taken out on this home.
Original Mortgage
$227,150
Interest Rate
6.78%
Purchase Details
Closed on
Mar 11, 1998
Sold by
Maf Developments Inc
Bought by
Blake Builders Inc
Home Financials for this Owner
Home Financials are based on the most recent Mortgage that was taken out on this home.
Original Mortgage
$50,150
Interest Rate
7.26%
Create a Home Valuation Report for This Property
The Home Valuation Report is an in-depth analysis detailing your home's value as well as a comparison with similar homes in the area
Home Values in the Area
Average Home Value in this Area
Purchase History
| Date | Buyer | Sale Price | Title Company |
|---|---|---|---|
| Sexton Amy J | -- | None Listed On Document | |
| Sexton Sean T | -- | None Listed On Document | |
| Sexton Sean T | $310,500 | -- | |
| Blake Builders Inc | $67,000 | Chicago Title Insurance Co |
Source: Public Records
Mortgage History
| Date | Status | Borrower | Loan Amount |
|---|---|---|---|
| Previous Owner | Sexton Sean T | $227,150 | |
| Previous Owner | Blake Builders Inc | $50,150 | |
| Closed | Sexton Sean T | $16,850 |
Source: Public Records
Tax History Compared to Growth
Tax History
| Year | Tax Paid | Tax Assessment Tax Assessment Total Assessment is a certain percentage of the fair market value that is determined by local assessors to be the total taxable value of land and additions on the property. | Land | Improvement |
|---|---|---|---|---|
| 2024 | $12,258 | $195,147 | $48,511 | $146,636 |
| 2023 | $12,258 | $172,391 | $42,854 | $129,537 |
| 2022 | $12,070 | $172,589 | $40,541 | $132,048 |
| 2021 | $11,536 | $164,370 | $38,610 | $125,760 |
| 2020 | $11,316 | $161,765 | $37,998 | $123,767 |
| 2019 | $11,122 | $157,206 | $36,927 | $120,279 |
| 2018 | $11,070 | $153,783 | $36,113 | $117,670 |
| 2017 | $10,901 | $149,813 | $35,181 | $114,632 |
| 2016 | $10,881 | $146,588 | $34,424 | $112,164 |
| 2015 | $10,436 | $140,950 | $33,100 | $107,850 |
| 2014 | $10,436 | $130,792 | $33,100 | $97,692 |
| 2013 | $10,436 | $130,792 | $33,100 | $97,692 |
Source: Public Records
Map
Nearby Homes
- 2255 Wendt Cir
- 1736 Robert Ln
- 1804 Princess Cir
- 4007 Heron Ct Unit 1
- 29W316 Andermann Dr
- 3616 Eliot Ln
- 2711 Wait Rd
- 1112 Saratoga Ct
- 3816 Rosada Dr
- 3432 Caine Dr
- 3707 Junebreeze Ln
- 3105 Saganashkee Ln
- 1116 Hollingswood Ave
- 3508 Tussell St
- 2949 Brossman St
- 3004 Bennett Dr
- 1987 Baldwin Way
- 2207 Sisters Ave
- 26106 W Sherwood Cir
- 23234 W Allagash Dr
- 2231 Haider Ave
- 2223 Haider Ave
- 2219 Haider Ave Unit 1
- 2235 Haider Ave
- 2228 Haider Ave
- 2232 Haider Ave
- 2239 Haider Ave
- 2215 Haider Ave
- 2224 Haider Ave
- 2236 Haider Ave
- 2220 Haider Ave
- 2243 Haider Ave
- 2240 Haider Ave
- 2211 Haider Ave
- 2216 Haider Ave
- 2111 Wicklow Rd
- 2115 Wicklow Rd
- 2107 Wicklow Rd Unit 1
- 2244 Haider Ave
- 2207 Wendt Cir