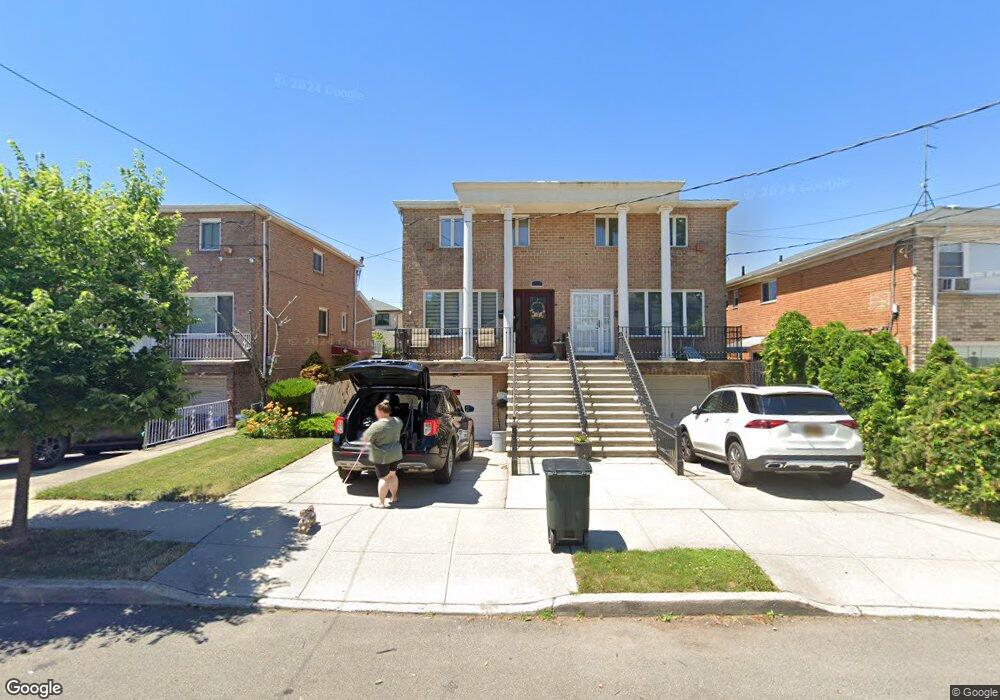
2228 E 70th St Brooklyn, NY 11234
Bergen Beach NeighborhoodEstimated Value: $1,027,000 - $1,209,184
Studio
--
Bath
2,800
Sq Ft
$392/Sq Ft
Est. Value
About This Home
This home is located at 2228 E 70th St, Brooklyn, NY 11234 and is currently estimated at $1,098,296, approximately $392 per square foot. 2228 E 70th St is a home located in Kings County with nearby schools including P.S. 312 Bergen Beach, James Madison High School, and Success Academy Charter School - Bergen Beach.
Ownership History
Date
Name
Owned For
Owner Type
Purchase Details
Closed on
Aug 8, 2019
Sold by
Stasolla Natalie M and Stasolla Pasquale
Bought by
Stasolla Maria
Current Estimated Value
Purchase Details
Closed on
Mar 11, 2016
Sold by
Lester Gamzon Revocable Living Trust
Bought by
Stasolla Natalie M and Stasolla Pasquale
Home Financials for this Owner
Home Financials are based on the most recent Mortgage that was taken out on this home.
Original Mortgage
$492,000
Interest Rate
3.65%
Mortgage Type
Purchase Money Mortgage
Purchase Details
Closed on
May 10, 2012
Sold by
Gamzon Lester
Bought by
Gamzon Lester and Lester Gamzon Revocable Living Trust
Purchase Details
Closed on
Sep 25, 1996
Sold by
Demeo Ferdinando Donorio
Bought by
Gamzon Lester and Gamzon Teena
Home Financials for this Owner
Home Financials are based on the most recent Mortgage that was taken out on this home.
Original Mortgage
$200,000
Interest Rate
7.75%
Create a Home Valuation Report for This Property
The Home Valuation Report is an in-depth analysis detailing your home's value as well as a comparison with similar homes in the area
Home Values in the Area
Average Home Value in this Area
Purchase History
We collect this data history from publicly available records. To have your information removed, we recommend requesting removal directly through your county’s website.
| Date | Buyer | Sale Price | Title Company |
|---|---|---|---|
| Stasolla Maria | -- | -- | |
| Stasolla Natalie M | $615,000 | -- | |
| Gamzon Lester | -- | -- | |
| Gamzon Lester | $295,000 | American Title Ins Co |
Source: Public Records
Mortgage History
We collect this data history from publicly available records. To have your information removed, we recommend requesting removal directly through your county’s website.
| Date | Status | Borrower | Loan Amount |
|---|---|---|---|
| Previous Owner | Stasolla Natalie M | $492,000 | |
| Previous Owner | Gamzon Lester | $200,000 |
Source: Public Records
Tax History
| Year | Tax Paid | Tax Assessment Tax Assessment Total Assessment is a certain percentage of the fair market value that is determined by local assessors to be the total taxable value of land and additions on the property. | Land | Improvement |
|---|---|---|---|---|
| 2026 | $11,742 | $64,620 | $14,880 | $49,740 |
| 2025 | $11,077 | $74,220 | $14,880 | $59,340 |
| 2024 | $11,077 | $58,620 | $14,880 | $43,740 |
| 2023 | $11,055 | $58,620 | $14,880 | $43,740 |
| 2022 | $10,253 | $57,540 | $14,880 | $42,660 |
| 2021 | $10,808 | $59,940 | $14,880 | $45,060 |
| 2020 | $5,097 | $53,280 | $14,880 | $38,400 |
| 2019 | $9,322 | $45,960 | $14,880 | $31,080 |
| 2018 | $8,950 | $45,363 | $12,335 | $33,028 |
| 2017 | $8,425 | $42,798 | $12,458 | $30,340 |
| 2016 | $8,246 | $42,798 | $10,635 | $32,163 |
| 2015 | $4,650 | $41,906 | $15,594 | $26,312 |
| 2014 | $4,650 | $39,536 | $14,712 | $24,824 |
Source: Public Records
Map
Nearby Homes
- 2248 E 70th St
- 2246 E 70th St
- 2223 E 70th St
- 2177 E 69th St
- 2233 E 72nd St
- 2151 E 71st St Unit 2155
- 2334 E 72nd St
- 2136 E 69th St
- 2224 E 74th St
- 2115 E 70th St
- 2310 E 66th St
- 7417 Avenue W
- 2309 E 65th St
- 2134 E 74th St Unit 2138
- 2102 E 73rd St
- 2072 E 68th St
- 2135 E 65th St
- 2063 E 71st St
- 2146 E 65th St
- 2140 E 65th St
- 2246 E 70th St Unit 2
- 2246 E 70th St Unit SINGLE
- 2250 E 70th St
- 2254 E 70th St
- 2244 E 70th St
- 2256 E 70th St
- 2240 E 70th St
- 2258 E 70th St
- 2234 E 70th St
- 2235-2239 E 69th St
- 2251 E 69th St
- 2260 E 70th St
- 2232 E 70th St
- 2233 E 69th St
- 2264 E 70th St
- 2231 E 69th St
- 2245 E 70th St
- 2249 E 70th St
- 2241 E 70th St
- 2253 E 70th St
Your Personal Tour Guide
Ask me questions while you tour the home.