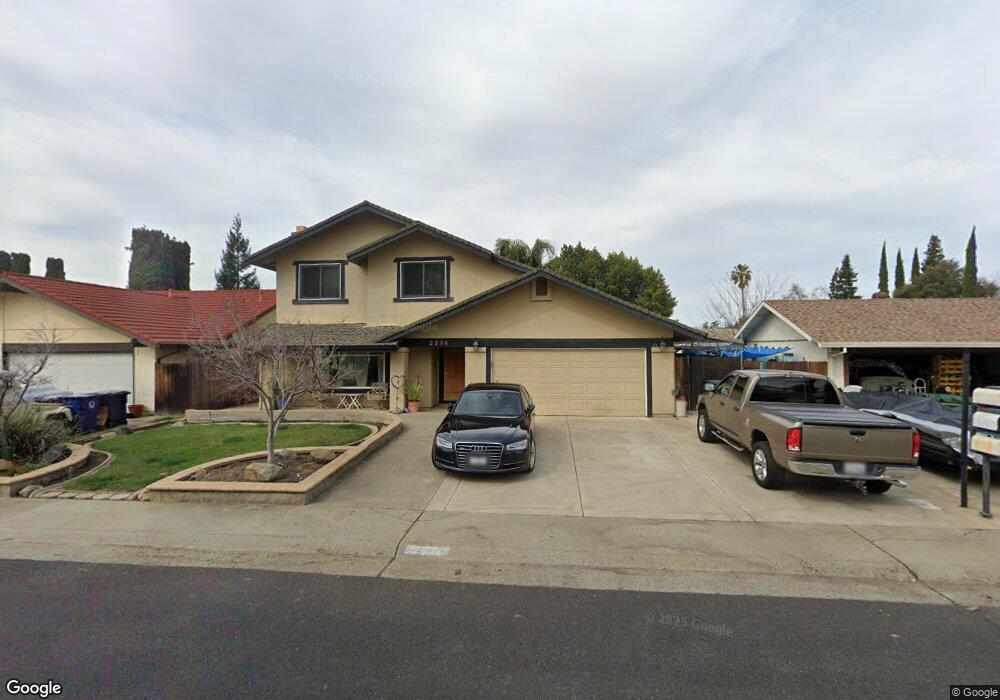
2236 River Trails Cir Rancho Cordova, CA 95670
Mills Ranch NeighborhoodEstimated Value: $370,000 - $555,938
4
Beds
3
Baths
2,112
Sq Ft
$224/Sq Ft
Est. Value
About This Home
This home is located at 2236 River Trails Cir, Rancho Cordova, CA 95670 and is currently estimated at $473,485, approximately $224 per square foot. 2236 River Trails Cir is a home located in Sacramento County with nearby schools including Peter J. Shields Elementary School, Riverview STEM Elementary School, and Mills Middle School.
Ownership History
Date
Name
Owned For
Owner Type
Purchase Details
Closed on
May 20, 2019
Sold by
Mayer Conrade C and Granger Mayer Melody L
Bought by
Mayer Conrade C and Granger Mayer Melody L
Current Estimated Value
Purchase Details
Closed on
Aug 2, 2016
Sold by
Mayer Conrade C and Granger Mayer Melody L
Bought by
Granger Mayer Melody L and Mayer Conrade C
Home Financials for this Owner
Home Financials are based on the most recent Mortgage that was taken out on this home.
Original Mortgage
$252,000
Outstanding Balance
$115,656
Interest Rate
3.56%
Mortgage Type
New Conventional
Estimated Equity
$357,829
Purchase Details
Closed on
Mar 25, 1999
Sold by
Ellis Kathleen A and Trust Of Kathleen A Ellis
Bought by
Mayer Conrade C and Granger Mayer Melody L
Purchase Details
Closed on
Oct 22, 1997
Sold by
Offer Kathleen A and Offer Kathleen A
Bought by
Ellis Kathleen A
Create a Home Valuation Report for This Property
The Home Valuation Report is an in-depth analysis detailing your home's value as well as a comparison with similar homes in the area
Home Values in the Area
Average Home Value in this Area
Purchase History
| Date | Buyer | Sale Price | Title Company |
|---|---|---|---|
| Mayer Conrade C | -- | None Available | |
| Granger Mayer Melody L | -- | Wfg National Title | |
| Mayer Conrade C | $128,000 | Stewart Title | |
| Ellis Kathleen A | -- | -- |
Source: Public Records
Mortgage History
| Date | Status | Borrower | Loan Amount |
|---|---|---|---|
| Open | Granger Mayer Melody L | $252,000 |
Source: Public Records
Tax History Compared to Growth
Tax History
| Year | Tax Paid | Tax Assessment Tax Assessment Total Assessment is a certain percentage of the fair market value that is determined by local assessors to be the total taxable value of land and additions on the property. | Land | Improvement |
|---|---|---|---|---|
| 2025 | $2,502 | $215,411 | $74,137 | $141,274 |
| 2024 | $2,502 | $211,188 | $72,684 | $138,504 |
| 2023 | $2,451 | $207,048 | $71,259 | $135,789 |
| 2022 | $2,418 | $202,989 | $69,862 | $133,127 |
| 2021 | $2,370 | $199,010 | $68,493 | $130,517 |
| 2020 | $2,353 | $196,970 | $67,791 | $129,179 |
| 2019 | $2,314 | $193,109 | $66,462 | $126,647 |
| 2018 | $2,254 | $189,323 | $65,159 | $124,164 |
| 2017 | $2,196 | $185,612 | $63,882 | $121,730 |
| 2016 | $2,149 | $181,974 | $62,630 | $119,344 |
| 2015 | $2,039 | $179,242 | $61,690 | $117,552 |
| 2014 | $2,170 | $175,732 | $60,482 | $115,250 |
Source: Public Records
Map
Nearby Homes
- 2222 River Trails Cir
- 2203 River Trails Cir
- 2331 Pecan Grove Way
- 10532 Coloma Rd
- 10465 Rugby Ct
- 10493 Georgetown Dr
- 2240 Chase Dr
- 10357 Daniel Way
- 10677 Beclan Dr
- 2344 Glenfaire Dr
- 10412 Dolecetto Dr
- 2133 Rossmoor Dr
- 10343 Holmes Way
- 2420 Glenfaire Dr
- 2628 Tronero Way
- 2640 Tronero Way
- 10745 Pedro Way
- 2700 Mendonca Dr
- 10228 Coloma Rd
- 10664 Valley View Dr
- 2240 River Trails Cir
- 2228 River Trails Cir
- 2248 River Trails Cir
- 2224 River Trails Cir
- 2237 River Trails Cir
- 2250 River Trails Cir
- 2235 River Trails Cir
- 2239 River Trails Cir
- 2247 River Trails Cir
- 2227 River Trails Cir
- 2245 River Trails Cir
- 2229 River Trails Cir
- 2233 River Trails Cir
- 2249 River Trails Cir
- 2225 River Trails Cir
- 2252 River Trails Cir
- 2220 River Trails Cir
- 2241 River Trails Cir
- 2243 River Trails Cir
- 2231 River Trails Cir