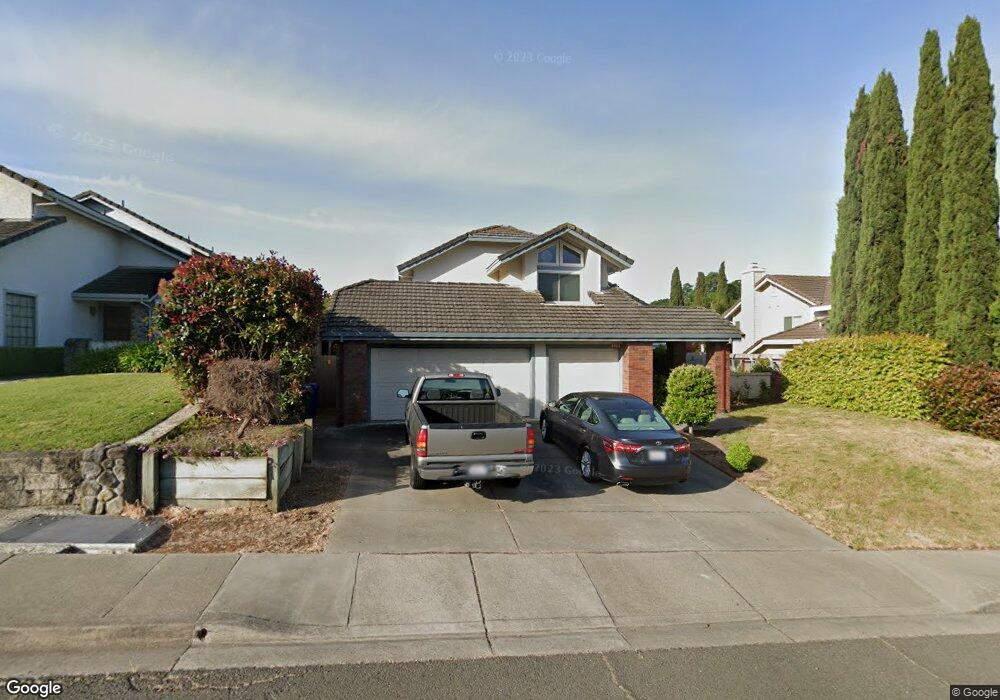
2238 Pheasant Dr Hercules, CA 94547
Estimated Value: $889,574 - $1,015,000
5
Beds
3
Baths
2,390
Sq Ft
$398/Sq Ft
Est. Value
About This Home
This home is located at 2238 Pheasant Dr, Hercules, CA 94547 and is currently estimated at $950,894, approximately $397 per square foot. 2238 Pheasant Dr is a home located in Contra Costa County with nearby schools including Hanna Ranch Elementary School, Hercules Middle School, and Hercules High School.
Ownership History
Date
Name
Owned For
Owner Type
Purchase Details
Closed on
Oct 10, 2001
Sold by
Cherry Jane and Rodgers Martha Jane
Bought by
Fissell Robert E and Fissell Lynn
Current Estimated Value
Home Financials for this Owner
Home Financials are based on the most recent Mortgage that was taken out on this home.
Original Mortgage
$270,000
Interest Rate
6.88%
Mortgage Type
Purchase Money Mortgage
Purchase Details
Closed on
Apr 1, 1999
Sold by
Rodney Palmer
Bought by
Cherry Jane and Rodgers Martha Jane
Purchase Details
Closed on
Jun 20, 1994
Sold by
Ge Capital Mtg Services Inc
Bought by
Cherry Jane and Palmer Rodney
Home Financials for this Owner
Home Financials are based on the most recent Mortgage that was taken out on this home.
Original Mortgage
$180,000
Interest Rate
8.6%
Mortgage Type
Purchase Money Mortgage
Purchase Details
Closed on
Mar 24, 1994
Sold by
Professional Foreclosure Corp
Bought by
Ge Capital Mtg Services Inc
Create a Home Valuation Report for This Property
The Home Valuation Report is an in-depth analysis detailing your home's value as well as a comparison with similar homes in the area
Home Values in the Area
Average Home Value in this Area
Purchase History
| Date | Buyer | Sale Price | Title Company |
|---|---|---|---|
| Fissell Robert E | $495,000 | Fidelity National Title Co | |
| Cherry Jane | -- | -- | |
| Cherry Jane | $260,000 | Old Republic Title Company | |
| Ge Capital Mtg Services Inc | $300,000 | North American Title Co |
Source: Public Records
Mortgage History
| Date | Status | Borrower | Loan Amount |
|---|---|---|---|
| Closed | Fissell Robert E | $270,000 | |
| Previous Owner | Cherry Jane | $180,000 |
Source: Public Records
Tax History
| Year | Tax Paid | Tax Assessment Tax Assessment Total Assessment is a certain percentage of the fair market value that is determined by local assessors to be the total taxable value of land and additions on the property. | Land | Improvement |
|---|---|---|---|---|
| 2025 | $10,706 | $731,392 | $295,451 | $435,941 |
| 2024 | $10,124 | $717,052 | $289,658 | $427,394 |
| 2023 | $10,124 | $702,993 | $283,979 | $419,014 |
| 2022 | $10,015 | $689,210 | $278,411 | $410,799 |
| 2021 | $10,015 | $675,697 | $272,952 | $402,745 |
| 2019 | $9,648 | $655,657 | $264,857 | $390,800 |
| 2018 | $9,134 | $642,802 | $259,664 | $383,138 |
| 2017 | $9,021 | $616,000 | $248,837 | $367,163 |
| 2016 | $8,122 | $547,000 | $220,964 | $326,036 |
| 2015 | $8,224 | $545,000 | $245,000 | $300,000 |
| 2014 | $8,283 | $542,500 | $219,147 | $323,353 |
Source: Public Records
Map
Nearby Homes
- 211 Meadowlark Way
- 2654 Tamalpais Dr Unit 38
- 2620 Shady Draw
- 1723 Pheasant Dr
- 118 Cottonwood Ct
- 2662 Carmelita Way
- 161 Seaway Ct
- 103 Obsidian Way
- 2555 Arroyo Ave
- 301 Boatswain Ct
- 2457 Ramona St
- 266 Scotts Valley
- 2420 Tomar Ct
- 1407 Forest Run
- 1405 Forest Run
- 398 N Wildwood
- 256 Napoli Ct Unit 256
- 603 Forest Run
- 1002 Forest Run Unit 1002
- 103 Tuscany Ct
- 2232 Pheasant Dr
- 2244 Pheasant Dr
- 151 Lapis Ct
- 2250 Pheasant Dr
- 2226 Pheasant Dr
- 157 Lapis Ct
- 2241 Pheasant Dr
- 2235 Pheasant Dr
- 2256 Pheasant Dr
- 2220 Pheasant Dr
- 145 Lapis Ct
- 2247 Pheasant Dr
- 163 Lapis Ct
- 139 Lapis Ct
- 2253 Pheasant Dr
- 2214 Pheasant Dr
- 2268 Pheasant Dr
- 133 Lapis Ct
- 160 Lapis Ct
- 2259 Pheasant Dr
Your Personal Tour Guide
Ask me questions while you tour the home.