Estimated Value: $1,085,000 - $1,217,000
4
Beds
2
Baths
2,017
Sq Ft
$576/Sq Ft
Est. Value
About This Home
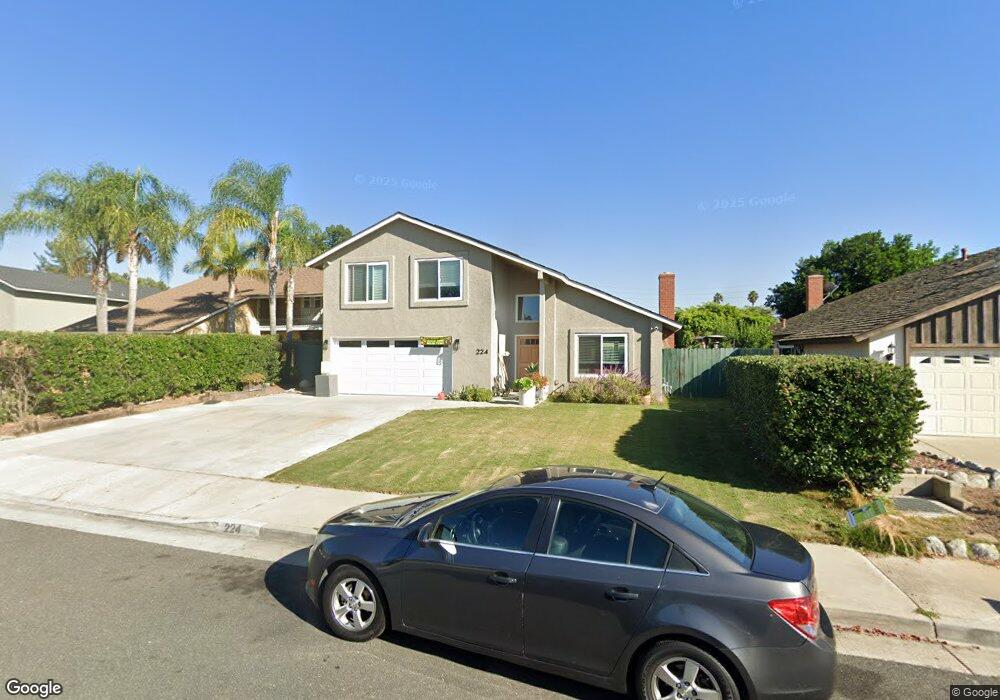
This home is located at 224 Camphor Cir, Brea, CA 92821 and is currently estimated at $1,161,130, approximately $575 per square foot. 224 Camphor Cir is a home located in Orange County with nearby schools including Brea Country Hills Elementary School, Brea Junior High School, and Brea-Olinda High School.
Ownership History
Date
Name
Owned For
Owner Type
Purchase Details
Closed on
Aug 18, 2016
Sold by
Barrett Richard C and Barrett Virginia L
Bought by
Cruz Nicholas N and Tyree Cruz Priscilla Ann
Current Estimated Value
Home Financials for this Owner
Home Financials are based on the most recent Mortgage that was taken out on this home.
Original Mortgage
$466,396
Interest Rate
4.75%
Mortgage Type
FHA
Purchase Details
Closed on
Dec 22, 2009
Sold by
Barrett Richard C and Barrett Virginia L
Bought by
Barrett Richard C and Barrett Virginia L
Purchase Details
Closed on
Oct 20, 2009
Sold by
Tyree Priscilla A
Bought by
Barrett Richard C and Barrett Virginia L
Home Financials for this Owner
Home Financials are based on the most recent Mortgage that was taken out on this home.
Original Mortgage
$270,000
Interest Rate
4%
Mortgage Type
New Conventional
Purchase Details
Closed on
Oct 10, 2006
Sold by
Messina Barbara
Bought by
Tyree George W and Tyree Priscilla A
Home Financials for this Owner
Home Financials are based on the most recent Mortgage that was taken out on this home.
Original Mortgage
$585,000
Interest Rate
8.2%
Mortgage Type
Stand Alone First
Create a Home Valuation Report for This Property
The Home Valuation Report is an in-depth analysis detailing your home's value as well as a comparison with similar homes in the area
Home Values in the Area
Average Home Value in this Area
Purchase History
| Date | Buyer | Sale Price | Title Company |
|---|---|---|---|
| Cruz Nicholas N | $475,000 | Lawyers Title | |
| Barrett Richard C | -- | Ticor Title Co | |
| Barrett Richard C | $415,000 | Ticor Title Co | |
| Tyree George W | $650,000 | Fnt |
Source: Public Records
Mortgage History
| Date | Status | Borrower | Loan Amount |
|---|---|---|---|
| Previous Owner | Cruz Nicholas N | $466,396 | |
| Previous Owner | Barrett Richard C | $270,000 | |
| Previous Owner | Tyree George W | $585,000 |
Source: Public Records
Tax History
| Year | Tax Paid | Tax Assessment Tax Assessment Total Assessment is a certain percentage of the fair market value that is determined by local assessors to be the total taxable value of land and additions on the property. | Land | Improvement |
|---|---|---|---|---|
| 2025 | $7,486 | $667,333 | $525,968 | $141,365 |
| 2024 | $7,486 | $654,249 | $515,655 | $138,594 |
| 2023 | $7,279 | $641,421 | $505,544 | $135,877 |
| 2022 | $7,210 | $628,845 | $495,632 | $133,213 |
| 2021 | $7,074 | $616,515 | $485,914 | $130,601 |
| 2020 | $7,026 | $610,194 | $480,932 | $129,262 |
| 2019 | $6,836 | $598,230 | $471,502 | $126,728 |
| 2018 | $6,732 | $586,500 | $462,256 | $124,244 |
| 2017 | $6,604 | $670,000 | $545,838 | $124,162 |
| 2016 | $5,325 | $452,517 | $310,152 | $142,365 |
| 2015 | $5,251 | $445,720 | $305,493 | $140,227 |
| 2014 | $5,100 | $436,989 | $299,508 | $137,481 |
Source: Public Records
Map
Nearby Homes
- 136 Donnybrook Rd
- 1796 Ravencrest Dr
- 2304 Carrotwood Dr
- 2440 Sanabria Ln
- 2418 Rainbow Ln
- 341 Adalina Ln
- 570 Olive Ave
- 2851 Rolling Hills Dr Unit 178
- 2851 Rolling Hills Dr Unit 257
- 2851 Rolling Hills Dr Unit 248
- 2851 Rolling Hills Dr
- 2849 Tarragon Ct
- 688 Buttonwood Dr
- 2583 Sandpebble Ln
- 3054 Associated Rd Unit 20
- 145 S Poplar Ave Unit 20
- 360 Meadow Ct
- 520 N Bardsdale Place
- 2826 Lemonwood Ct
- 38 Rogers Ct
- 218 Camphor Cir
- 230 Camphor Cir
- 231 Valverde Ave
- 225 Valverde Ave
- 236 Camphor Cir
- 212 Camphor Cir
- 219 Valverde Ave
- 237 Valverde Ave
- 221 Camphor Cir
- 227 Camphor Cir
- 242 Camphor Cir
- 215 Camphor Cir
- 213 Valverde Ave
- 206 Camphor Cir
- 233 Camphor Cir
- 203 Camphor Cir
- 209 Camphor Cir
- 248 Camphor Cir
- 207 Valverde Ave
- 239 Camphor Cir
Your Personal Tour Guide
Ask me questions while you tour the home.