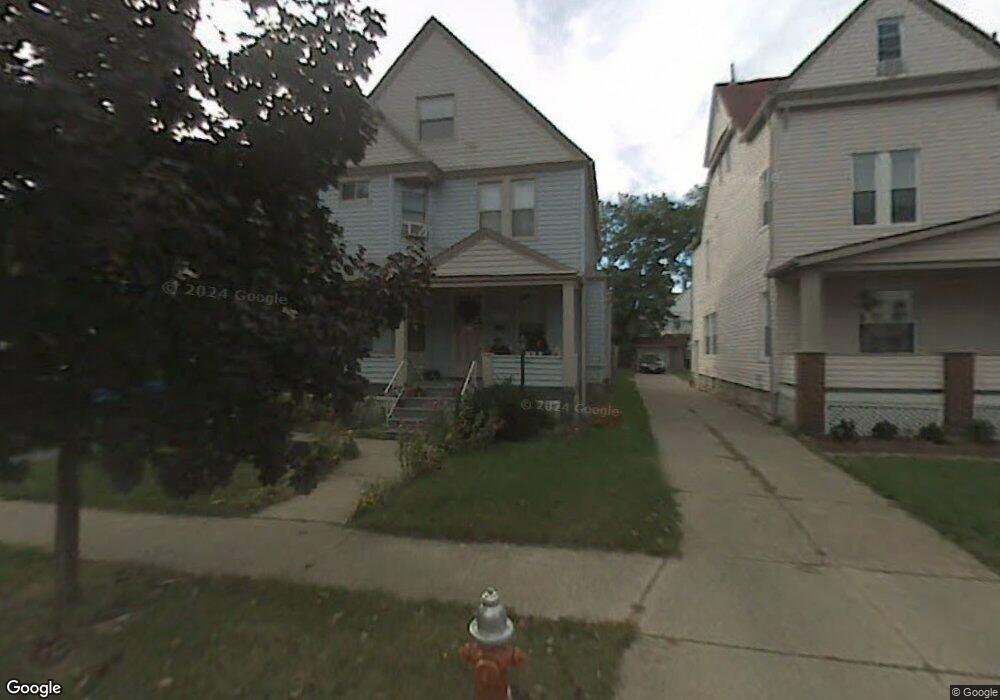
2248 E 87th St Cleveland, OH 44106
Fairfax NeighborhoodEstimated Value: $122,859 - $179,000
6
Beds
1
Bath
1,973
Sq Ft
$79/Sq Ft
Est. Value
About This Home
This home is located at 2248 E 87th St, Cleveland, OH 44106 and is currently estimated at $156,465, approximately $79 per square foot. 2248 E 87th St is a home located in Cuyahoga County with nearby schools including St. Adalbert Catholic School.
Ownership History
Date
Name
Owned For
Owner Type
Purchase Details
Closed on
Nov 27, 2001
Sold by
Fairfax Renaissance Development Corp
Bought by
Wilson Debra
Current Estimated Value
Home Financials for this Owner
Home Financials are based on the most recent Mortgage that was taken out on this home.
Original Mortgage
$95,000
Outstanding Balance
$36,507
Interest Rate
6.64%
Estimated Equity
$119,958
Purchase Details
Closed on
Oct 19, 2000
Sold by
Wise Eddie Mae
Bought by
Fairfax Renaissance Development Corp
Purchase Details
Closed on
Mar 15, 1991
Sold by
Nichols Eve
Bought by
Wise Eddie Mae
Purchase Details
Closed on
Jan 11, 1989
Sold by
Nichols Eve
Bought by
Nichols Eve
Purchase Details
Closed on
Nov 17, 1988
Sold by
Wade Geneva Terry
Bought by
Nichols Eve
Purchase Details
Closed on
Jan 1, 1975
Bought by
Wade Wm and Wade Geneva
Create a Home Valuation Report for This Property
The Home Valuation Report is an in-depth analysis detailing your home's value as well as a comparison with similar homes in the area
Home Values in the Area
Average Home Value in this Area
Purchase History
| Date | Buyer | Sale Price | Title Company |
|---|---|---|---|
| Wilson Debra | $113,000 | Equity Title Agency Inc | |
| Fairfax Renaissance Development Corp | $35,000 | -- | |
| Wise Eddie Mae | $5,500 | -- | |
| Nichols Eve | -- | -- | |
| Nichols Eve | -- | -- | |
| Wade Geneva Terry | -- | -- | |
| Wade Wm | -- | -- |
Source: Public Records
Mortgage History
| Date | Status | Borrower | Loan Amount |
|---|---|---|---|
| Open | Wilson Debra | $95,000 | |
| Closed | Wilson Debra | $10,000 |
Source: Public Records
Tax History
| Year | Tax Paid | Tax Assessment Tax Assessment Total Assessment is a certain percentage of the fair market value that is determined by local assessors to be the total taxable value of land and additions on the property. | Land | Improvement |
|---|---|---|---|---|
| 2025 | $1,859 | $38,500 | $4,970 | $33,530 |
| 2024 | $1,881 | $38,500 | $4,970 | $33,530 |
| 2023 | $1,482 | $28,710 | $2,700 | $26,010 |
| 2022 | $1,505 | $28,700 | $2,700 | $26,010 |
| 2021 | $2,143 | $28,700 | $2,700 | $26,010 |
| 2020 | $2,295 | $26,570 | $2,490 | $24,080 |
| 2019 | $2,122 | $75,900 | $7,100 | $68,800 |
| 2018 | $2,115 | $26,570 | $2,490 | $24,080 |
| 2017 | $2,482 | $30,100 | $1,400 | $28,700 |
| 2016 | $2,463 | $30,100 | $1,400 | $28,700 |
| 2015 | $2,354 | $30,100 | $1,400 | $28,700 |
| 2014 | $2,354 | $28,670 | $1,330 | $27,340 |
Source: Public Records
Map
Nearby Homes
- 2245 E 87th St
- 2256 E 85th St
- 2198 E 86th St
- 2240 E 90th St
- 2292 E 90th St
- 2164 E 87th St
- 2351 E 86th St
- 2291 E 90th St
- 2206 E 93rd St
- 2288 E 95th St
- 2254 E 81st St
- 2346 E 82nd St
- 2314 E 95th St
- 2230 E 97th St
- 2183 E 95th St
- 2200 E 81st St
- 2296 E 97th St
- 0 E 86th St Unit 5150892
- 8801 Beckman Ave
- 2182 E 80th St
Your Personal Tour Guide
Ask me questions while you tour the home.