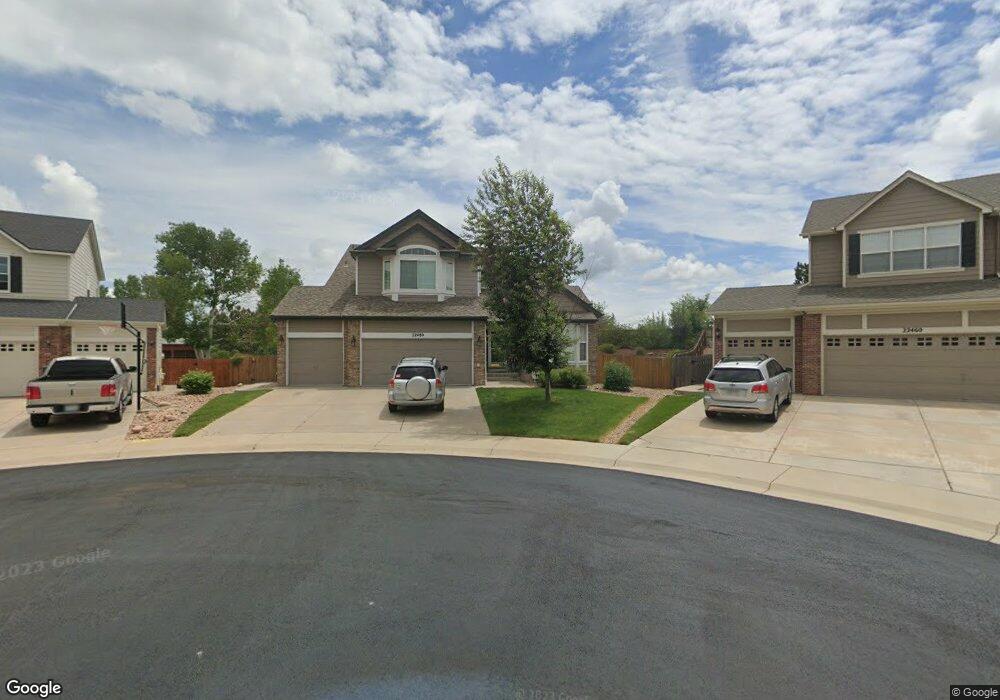
22480 Pebble Brook Ln Parker, CO 80138
Villages of Parker NeighborhoodEstimated Value: $721,000 - $806,000
4
Beds
4
Baths
3,857
Sq Ft
$195/Sq Ft
Est. Value
About This Home
This home is located at 22480 Pebble Brook Ln, Parker, CO 80138 and is currently estimated at $751,631, approximately $194 per square foot. 22480 Pebble Brook Ln is a home located in Douglas County with nearby schools including Pioneer Elementary School, Cimarron Middle School, and Legend High School.
Ownership History
Date
Name
Owned For
Owner Type
Purchase Details
Closed on
Nov 30, 2015
Sold by
Belcher Carl H and Belcher Andrea S
Bought by
Widdison Bryan L and Widdison Amanda E W
Current Estimated Value
Home Financials for this Owner
Home Financials are based on the most recent Mortgage that was taken out on this home.
Original Mortgage
$407,433
Outstanding Balance
$320,914
Interest Rate
3.75%
Mortgage Type
FHA
Estimated Equity
$430,717
Purchase Details
Closed on
May 25, 2001
Sold by
Richmond American Homes Of Colorado Inc
Bought by
Belcher Carl H and Belcher Andrea S
Home Financials for this Owner
Home Financials are based on the most recent Mortgage that was taken out on this home.
Original Mortgage
$249,400
Interest Rate
7.1%
Mortgage Type
Balloon
Purchase Details
Closed on
Aug 3, 2000
Sold by
Canterberry Development Co Inc
Bought by
Richmond American Homes Of Colo Inc
Purchase Details
Closed on
Mar 3, 1999
Sold by
Parker Land Assoc
Bought by
Canterberry Dev Co
Create a Home Valuation Report for This Property
The Home Valuation Report is an in-depth analysis detailing your home's value as well as a comparison with similar homes in the area
Home Values in the Area
Average Home Value in this Area
Purchase History
| Date | Buyer | Sale Price | Title Company |
|---|---|---|---|
| Widdison Bryan L | $414,950 | Colorado Escrow & Title | |
| Belcher Carl H | $311,785 | Stewart Title | |
| Richmond American Homes Of Colo Inc | $953,400 | -- | |
| Canterberry Dev Co | $14,360,900 | -- |
Source: Public Records
Mortgage History
| Date | Status | Borrower | Loan Amount |
|---|---|---|---|
| Open | Widdison Bryan L | $407,433 | |
| Previous Owner | Belcher Carl H | $249,400 |
Source: Public Records
Tax History Compared to Growth
Tax History
| Year | Tax Paid | Tax Assessment Tax Assessment Total Assessment is a certain percentage of the fair market value that is determined by local assessors to be the total taxable value of land and additions on the property. | Land | Improvement |
|---|---|---|---|---|
| 2024 | $4,202 | $51,790 | $10,180 | $41,610 |
| 2023 | $4,252 | $51,790 | $10,180 | $41,610 |
| 2022 | $3,136 | $36,270 | $5,840 | $30,430 |
| 2021 | $3,265 | $36,270 | $5,840 | $30,430 |
| 2020 | $3,134 | $35,400 | $5,180 | $30,220 |
| 2019 | $3,153 | $35,400 | $5,180 | $30,220 |
| 2018 | $2,923 | $31,980 | $5,610 | $26,370 |
| 2017 | $2,712 | $31,980 | $5,610 | $26,370 |
| 2016 | $2,502 | $28,960 | $4,640 | $24,320 |
| 2015 | $2,548 | $28,960 | $4,640 | $24,320 |
| 2014 | $1,244 | $25,210 | $5,250 | $19,960 |
Source: Public Records
Map
Nearby Homes
- 11333 S Lost Creek Cir
- 11465 Canterberry Ln
- 22695 E River Chase Way
- 11584 Pine Canyon Ln
- 22935 E River Chase Way
- 23078 E River Chase Way
- 23014 Milford Ln
- 11660 Coeur d Alene Dr
- 11656 Pine Canyon Dr
- 23080 York Ave
- 11691 Riverdale Dr
- 21906 Swale Dr
- 23235 E York Ave
- 23245 E York Ave
- 23300 York Ave
- 22380 Quail Run Dr
- 22389 Quail Run Dr
- 21796 Silver Meadow Ln
- 22938 Blackwolf Way
- 11042 Blackwolf Ln
- 22460 Pebble Brook Ln
- 22485 Pebble Brook Ln
- 22453 Pebble Brook Ln
- 22456 Pebble Brook Ln
- 22437 Pebble Brook Ln
- 22432 Pebble Brook Ln
- 22421 Pebble Brook Ln
- 22408 Pebble Brook Ln
- 22405 Pebble Brook Ln
- 22384 Pebble Brook Ln
- 22389 Pebble Brook Ln
- 22455 Laurel Oak Dr
- 22360 Pebble Brook Ln
- 22373 Pebble Brook Ln
- 22336 Pebble Brook Ln
- 22425 Laurel Oak Dr
- 22357 Pebble Brook Ln
- 22312 Pebble Brook Ln
- 22166 Wintergreen Way
- 22164 Wintergreen Way