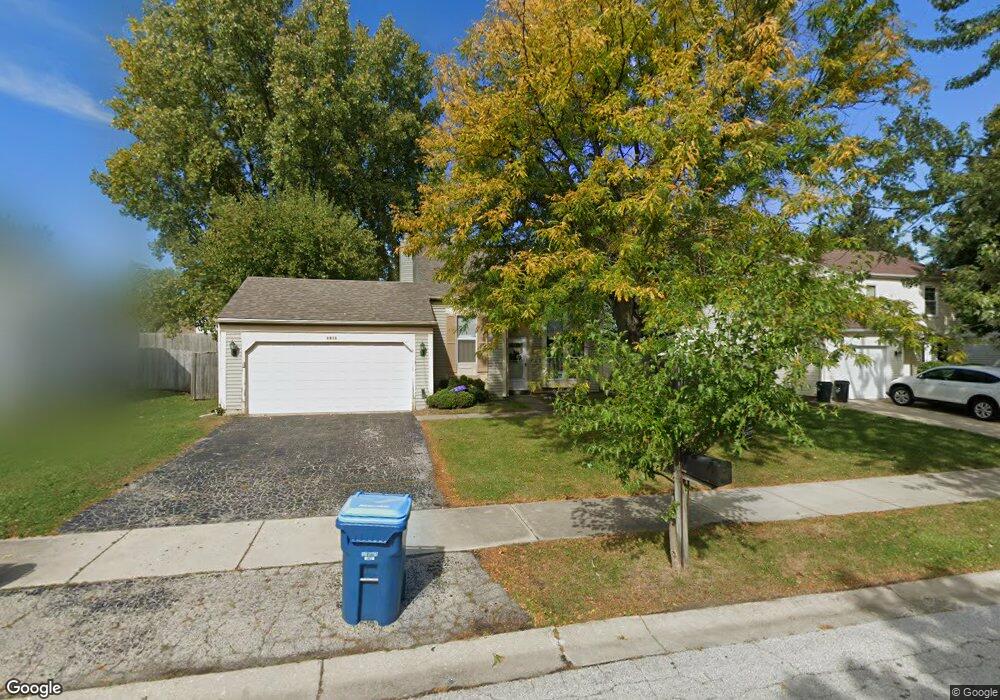
2258 Highfield Ln Unit 9 Aurora, IL 60504
South East Village NeighborhoodEstimated Value: $286,000 - $307,000
2
Beds
1
Bath
856
Sq Ft
$347/Sq Ft
Est. Value
About This Home
This home is located at 2258 Highfield Ln Unit 9, Aurora, IL 60504 and is currently estimated at $297,427, approximately $347 per square foot. 2258 Highfield Ln Unit 9 is a home located in DuPage County with nearby schools including Georgetown Elementary School, Fischer Middle School, and Waubonsie Valley High School.
Ownership History
Date
Name
Owned For
Owner Type
Purchase Details
Closed on
Oct 25, 2024
Sold by
Beatty Linda A
Bought by
Linda A Beatty Trust and Beatty
Current Estimated Value
Purchase Details
Closed on
Aug 22, 2000
Sold by
Mann Jeffery A and Mann Carol A
Bought by
Beatty Linda A
Home Financials for this Owner
Home Financials are based on the most recent Mortgage that was taken out on this home.
Original Mortgage
$70,125
Interest Rate
8.15%
Purchase Details
Closed on
Jan 19, 1996
Sold by
Carpenter Alan N and Carpenter Laura M
Bought by
Mann Jeffery A and Mann Carol A
Home Financials for this Owner
Home Financials are based on the most recent Mortgage that was taken out on this home.
Original Mortgage
$110,787
Interest Rate
7.19%
Mortgage Type
FHA
Create a Home Valuation Report for This Property
The Home Valuation Report is an in-depth analysis detailing your home's value as well as a comparison with similar homes in the area
Home Values in the Area
Average Home Value in this Area
Purchase History
| Date | Buyer | Sale Price | Title Company |
|---|---|---|---|
| Linda A Beatty Trust | -- | None Listed On Document | |
| Linda A Beatty Trust | -- | None Listed On Document | |
| Beatty Linda A | $127,500 | First American Title Ins | |
| Mann Jeffery A | $112,000 | -- |
Source: Public Records
Mortgage History
| Date | Status | Borrower | Loan Amount |
|---|---|---|---|
| Previous Owner | Beatty Linda A | $70,125 | |
| Previous Owner | Mann Jeffery A | $110,787 | |
| Closed | Beatty Linda A | $29,760 |
Source: Public Records
Tax History Compared to Growth
Tax History
| Year | Tax Paid | Tax Assessment Tax Assessment Total Assessment is a certain percentage of the fair market value that is determined by local assessors to be the total taxable value of land and additions on the property. | Land | Improvement |
|---|---|---|---|---|
| 2024 | $5,323 | $78,003 | $27,466 | $50,537 |
| 2023 | $5,046 | $70,090 | $24,680 | $45,410 |
| 2022 | $4,725 | $62,350 | $21,800 | $40,550 |
| 2021 | $4,591 | $60,120 | $21,020 | $39,100 |
| 2020 | $4,647 | $60,120 | $21,020 | $39,100 |
| 2019 | $4,471 | $57,180 | $19,990 | $37,190 |
| 2018 | $4,339 | $55,130 | $19,140 | $35,990 |
| 2017 | $4,258 | $53,260 | $18,490 | $34,770 |
| 2016 | $4,171 | $51,110 | $17,740 | $33,370 |
| 2015 | $4,113 | $48,520 | $16,840 | $31,680 |
| 2014 | $4,329 | $49,450 | $17,040 | $32,410 |
| 2013 | $4,286 | $49,790 | $17,160 | $32,630 |
Source: Public Records
Map
Nearby Homes
- 2297 Lakeside Dr Unit 10
- 2476 Village Ct Unit 2
- 1629 Silver Springs Ct
- 2632 Emma Cir
- 2489 Rosehall Ln
- 2509 Rosehall Ln
- 1335 Lawrence Ct
- 2730 Dorothy Dr Unit 1
- 1875 Keating Dr
- 1871 Keating Dr
- 1855 Keating Dr
- 1465 Bridgeport Ln Unit 19D
- 1882 Westridge Place
- 2860 Bridgeport Ln Unit 19D
- 2723 Rosehall Ln
- 1966 Congrove Dr
- 1853 Westridge Place
- 1896 Sedgegrass Trail
- 2484 Warwick Ct
- Bellamy Plan at Wheatland Crossing
- 2254 Highfield Ln Unit 9
- 2275 Highfield Ct
- 2266 Highfield Ln Unit 9
- 2265 Highfield Ct Unit 9
- 2250 Highfield Ln Unit 9
- 2263 Highfield Ln
- 2269 Highfield Ln
- 2259 Highfield Ln
- 2285 Highfield Ct Unit 9
- 2255 Highfield Ct
- 2255 Highfield Ln Unit 9
- 2270 Highfield Ln
- 2246 Highfield Ln Unit 9
- 2275 Highfield Ln Unit 9
- 2245 Highfield Ct Unit 9
- 2249 Highfield Ln Unit 9
- 2274 Highfield Ln Unit 9
- 2280 S Crescent Ln Unit 9
- 2270 S Crescent Ln Unit 9
- 2280 Highfield Ct