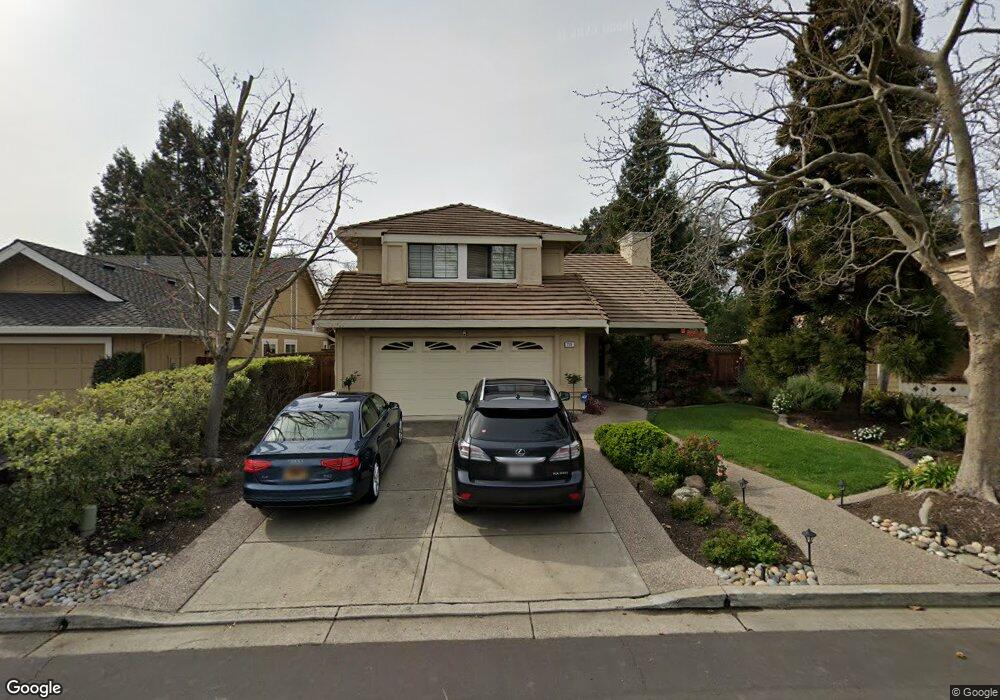
226 Monte Carlo Way Danville, CA 94506
Sycamore Valley NeighborhoodEstimated Value: $1,835,000 - $1,987,012
4
Beds
3
Baths
2,354
Sq Ft
$808/Sq Ft
Est. Value
About This Home
This home is located at 226 Monte Carlo Way, Danville, CA 94506 and is currently estimated at $1,901,003, approximately $807 per square foot. 226 Monte Carlo Way is a home located in Contra Costa County with nearby schools including Sycamore Valley Elementary School, Charlotte Wood Middle School, and San Ramon Valley High School.
Ownership History
Date
Name
Owned For
Owner Type
Purchase Details
Closed on
Oct 31, 2015
Sold by
Hashemizad Seyed Reza and Madani Shabnam
Bought by
Hashemizad Madani Family Trust
Current Estimated Value
Purchase Details
Closed on
May 8, 2006
Sold by
Barrett Timothy and Barrett Elaine
Bought by
Hashamizad Seyed and Madani Shabnam
Home Financials for this Owner
Home Financials are based on the most recent Mortgage that was taken out on this home.
Original Mortgage
$800,000
Outstanding Balance
$475,669
Interest Rate
6.87%
Mortgage Type
Purchase Money Mortgage
Estimated Equity
$1,425,334
Purchase Details
Closed on
May 11, 1998
Sold by
Hamilton John S and Hamilton Wendy I
Bought by
Barrett Timothy J and Barrett Elaine
Home Financials for this Owner
Home Financials are based on the most recent Mortgage that was taken out on this home.
Original Mortgage
$360,000
Interest Rate
7.13%
Mortgage Type
Balloon
Create a Home Valuation Report for This Property
The Home Valuation Report is an in-depth analysis detailing your home's value as well as a comparison with similar homes in the area
Home Values in the Area
Average Home Value in this Area
Purchase History
| Date | Buyer | Sale Price | Title Company |
|---|---|---|---|
| Hashemizad Madani Family Trust | -- | None Available | |
| Hashamizad Seyed | $1,050,000 | Financial Title Company | |
| Barrett Timothy J | $450,000 | First California Title Compa |
Source: Public Records
Mortgage History
| Date | Status | Borrower | Loan Amount |
|---|---|---|---|
| Open | Hashamizad Seyed | $800,000 | |
| Previous Owner | Barrett Timothy J | $360,000 | |
| Closed | Barrett Timothy J | $45,000 |
Source: Public Records
Tax History Compared to Growth
Tax History
| Year | Tax Paid | Tax Assessment Tax Assessment Total Assessment is a certain percentage of the fair market value that is determined by local assessors to be the total taxable value of land and additions on the property. | Land | Improvement |
|---|---|---|---|---|
| 2025 | $16,382 | $1,434,897 | $956,601 | $478,296 |
| 2024 | $16,134 | $1,406,763 | $937,845 | $468,918 |
| 2023 | $16,134 | $1,379,180 | $919,456 | $459,724 |
| 2022 | $16,015 | $1,352,138 | $901,428 | $450,710 |
| 2021 | $15,177 | $1,280,000 | $853,336 | $426,664 |
| 2019 | $14,408 | $1,200,000 | $800,002 | $399,998 |
| 2018 | $14,137 | $1,200,000 | $800,002 | $399,998 |
| 2017 | $13,132 | $1,130,000 | $753,336 | $376,664 |
| 2016 | $13,111 | $1,120,000 | $746,669 | $373,331 |
| 2015 | $12,454 | $1,057,500 | $705,001 | $352,499 |
| 2014 | $11,370 | $953,000 | $635,334 | $317,666 |
Source: Public Records
Map
Nearby Homes
- 134 Tivoli Ln
- 105 Creighton Way
- 3652 Old Blackhawk Rd
- 422 Sutton Cir
- 226 Promenade Ln
- 24 Timberview Ct
- 132 Victoria Place
- 6401 Camino Tassajara
- 314 W Meadows Ln
- 89 Amberfield Ln
- 140 Blackstone Dr
- 3466 Silver Maple Dr
- 32 Maximo Ct
- 2120 Goldenrod Ln
- 1000 Sunshine Cir
- 313 Camino Arroyo E
- 60 Rainbow Cir
- 3846 Sheffield Cir
- 404 Regal Lily Ln
- 16 Haskins Ranch Cir
- 228 Monte Carlo Way
- 224 Monte Carlo Way
- 222 Monte Carlo Way
- 342 Fontaine Ct
- 225 Monte Carlo Way
- 344 Fontaine Ct
- 227 Monte Carlo Way
- 221 Monte Carlo Way
- 220 Monte Carlo Way
- 219 Monte Carlo Way
- 218 Monte Carlo Way
- 341 Fontaine Ct
- 339 Fontaine Dr
- 346 Fontaine Ct
- 332 Fontaine Dr
- 337 Fontaine Dr
- 217 Monte Carlo Way
- 330 Fontaine Dr
- 216 Monte Carlo Way
- 343 Fontaine Ct