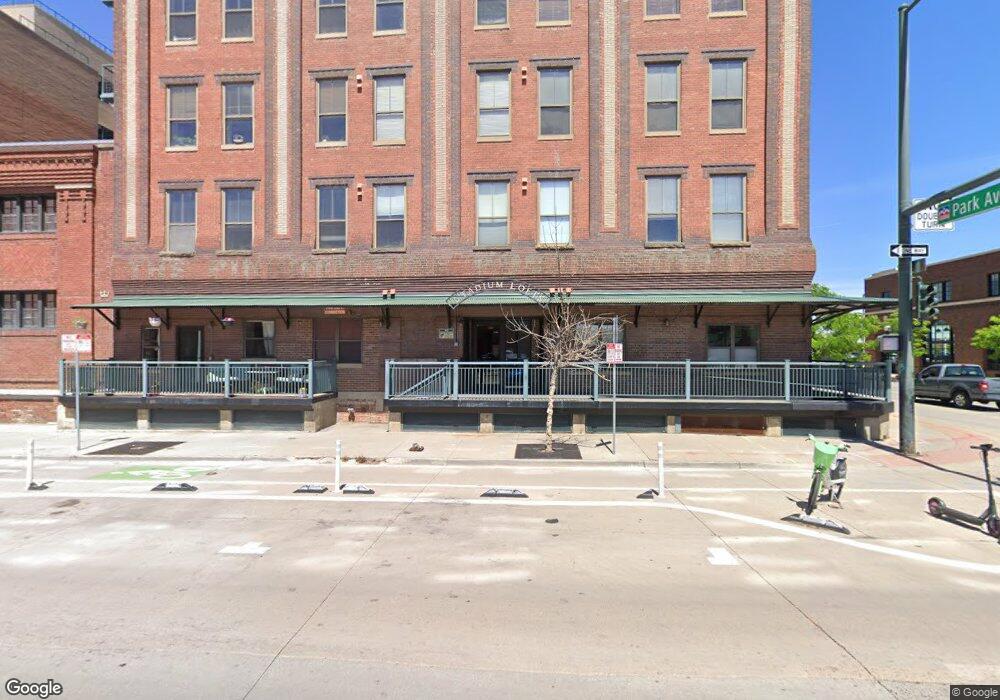
Stadium Lofts 2261 Blake St Unit 4G Denver, CO 80205
Lower Downtown NeighborhoodEstimated Value: $379,197 - $437,000
1
Bed
1
Bath
823
Sq Ft
$496/Sq Ft
Est. Value
About This Home
This home is located at 2261 Blake St Unit 4G, Denver, CO 80205 and is currently estimated at $408,549, approximately $496 per square foot. 2261 Blake St Unit 4G is a home located in Denver County with nearby schools including Whittier ECE-8 School, Cole Arts & Science Academy, and McAuliffe Manual Middle School.
Ownership History
Date
Name
Owned For
Owner Type
Purchase Details
Closed on
Jun 14, 2004
Sold by
Quinn Timothy Rj
Bought by
Montero Paul N
Current Estimated Value
Home Financials for this Owner
Home Financials are based on the most recent Mortgage that was taken out on this home.
Original Mortgage
$180,000
Outstanding Balance
$85,740
Interest Rate
5.62%
Mortgage Type
New Conventional
Estimated Equity
$322,809
Purchase Details
Closed on
Dec 1, 1998
Sold by
Eileen Jones Ginger
Bought by
Quinn Timothy Rj
Home Financials for this Owner
Home Financials are based on the most recent Mortgage that was taken out on this home.
Original Mortgage
$129,600
Interest Rate
6.69%
Purchase Details
Closed on
Aug 18, 1995
Sold by
Stadium Lofts Ltd
Bought by
Jones Ginger Eileen
Home Financials for this Owner
Home Financials are based on the most recent Mortgage that was taken out on this home.
Original Mortgage
$84,900
Interest Rate
7.59%
Create a Home Valuation Report for This Property
The Home Valuation Report is an in-depth analysis detailing your home's value as well as a comparison with similar homes in the area
Home Values in the Area
Average Home Value in this Area
Purchase History
| Date | Buyer | Sale Price | Title Company |
|---|---|---|---|
| Montero Paul N | $200,000 | Fahtco | |
| Quinn Timothy Rj | $162,000 | First American Heritage Titl | |
| Jones Ginger Eileen | $106,156 | Land Title |
Source: Public Records
Mortgage History
| Date | Status | Borrower | Loan Amount |
|---|---|---|---|
| Open | Montero Paul N | $180,000 | |
| Previous Owner | Quinn Timothy Rj | $129,600 | |
| Previous Owner | Jones Ginger Eileen | $84,900 |
Source: Public Records
Tax History Compared to Growth
Tax History
| Year | Tax Paid | Tax Assessment Tax Assessment Total Assessment is a certain percentage of the fair market value that is determined by local assessors to be the total taxable value of land and additions on the property. | Land | Improvement |
|---|---|---|---|---|
| 2024 | $1,990 | $25,130 | $2,240 | $22,890 |
| 2023 | $1,860 | $25,130 | $2,240 | $22,890 |
| 2022 | $1,860 | $24,230 | $6,140 | $18,090 |
| 2021 | $1,860 | $24,930 | $6,320 | $18,610 |
| 2020 | $1,957 | $26,380 | $3,890 | $22,490 |
| 2019 | $1,902 | $26,380 | $3,890 | $22,490 |
| 2018 | $1,739 | $22,480 | $1,860 | $20,620 |
| 2017 | $1,734 | $22,480 | $1,860 | $20,620 |
| 2016 | $1,669 | $20,470 | $2,165 | $18,305 |
| 2015 | $1,599 | $20,470 | $2,165 | $18,305 |
| 2014 | $1,226 | $14,760 | $1,735 | $13,025 |
Source: Public Records
About Stadium Lofts
Map
Nearby Homes
- 2229 Blake St Unit 402
- 2229 Blake St Unit 505
- 2245 Blake St Unit F
- 2245 Blake St Unit E
- 2245 Blake St Unit D
- 2261 Blake St Unit 4D
- 2261 Blake St Unit 3E
- 2261 Blake St Unit 5H
- 2101 Larimer St Unit 302
- 2400 N Broadway Unit 4
- 1940 Blake St Unit 301
- 1940 Blake St Unit 302
- 2193 Arapahoe St Unit 6
- 2500 Walnut St Unit 202
- 2500 Walnut St Unit 201
- 1901 Wazee St Unit 304
- 1901 Wazee St Unit 620
- 1901 Wazee St Unit 407
- 1901 Wazee St Unit 311
- 1901 Wazee St Unit 519
- 2261 Blake St Unit 2C
- 2261 Blake St Unit 2G
- 2261 Blake St
- 2261 Blake St
- 2261 Blake St
- 2261 Blake St Unit 6E
- 2261 Blake St Unit 6D
- 2261 Blake St
- 2261 Blake St Unit 6B
- 2261 Blake St Unit 6A
- 2261 Blake St
- 2261 Blake St
- 2261 Blake St Unit 5F
- 2261 Blake St Unit 5E
- 2261 Blake St Unit 5D
- 2261 Blake St Unit 5C
- 2261 Blake St Unit 5B
- 2261 Blake St Unit 5A
- 2261 Blake St Unit 4H
- 2261 Blake St Unit 4F