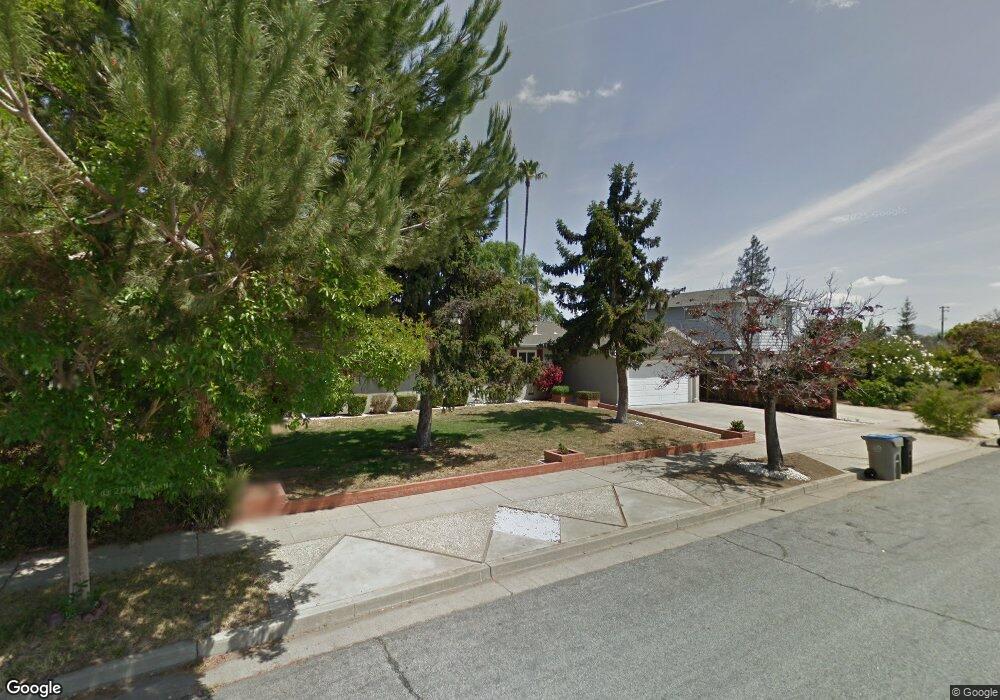
2261 Starbright Dr San Jose, CA 95124
Cambrian NeighborhoodEstimated Value: $1,736,000 - $1,966,000
3
Beds
2
Baths
1,370
Sq Ft
$1,357/Sq Ft
Est. Value
About This Home
This home is located at 2261 Starbright Dr, San Jose, CA 95124 and is currently estimated at $1,858,473, approximately $1,356 per square foot. 2261 Starbright Dr is a home located in Santa Clara County with nearby schools including Leigh High School, Branham High School, and Farnham Elementary School.
Ownership History
Date
Name
Owned For
Owner Type
Purchase Details
Closed on
Oct 31, 2021
Sold by
Sun Pu and Chee Wai Yin
Bought by
Sun Pu and Chee Wai Yin
Current Estimated Value
Purchase Details
Closed on
Oct 4, 2004
Sold by
Falo Llc
Bought by
Sun Pu and Chee Wai Yin
Home Financials for this Owner
Home Financials are based on the most recent Mortgage that was taken out on this home.
Original Mortgage
$500,000
Outstanding Balance
$219,896
Interest Rate
4.12%
Mortgage Type
Purchase Money Mortgage
Estimated Equity
$1,638,577
Purchase Details
Closed on
Aug 23, 2002
Sold by
Manzone Domenico J and Manzone Gabriella
Bought by
Palo Llc
Purchase Details
Closed on
Dec 9, 1997
Sold by
Manzone Domenico J
Bought by
Manzone Domenico J and Manzone Gabriella
Home Financials for this Owner
Home Financials are based on the most recent Mortgage that was taken out on this home.
Original Mortgage
$177,675
Interest Rate
7.23%
Create a Home Valuation Report for This Property
The Home Valuation Report is an in-depth analysis detailing your home's value as well as a comparison with similar homes in the area
Home Values in the Area
Average Home Value in this Area
Purchase History
| Date | Buyer | Sale Price | Title Company |
|---|---|---|---|
| Sun Pu | -- | None Available | |
| Sun Pu | $625,000 | First American Title Company | |
| Palo Llc | -- | -- | |
| Manzone Domenico J | -- | -- | |
| Manzone Domenico J | -- | Fidelity National Title Co |
Source: Public Records
Mortgage History
| Date | Status | Borrower | Loan Amount |
|---|---|---|---|
| Open | Sun Pu | $500,000 | |
| Previous Owner | Manzone Domenico J | $177,675 | |
| Closed | Sun Pu | $62,500 |
Source: Public Records
Tax History Compared to Growth
Tax History
| Year | Tax Paid | Tax Assessment Tax Assessment Total Assessment is a certain percentage of the fair market value that is determined by local assessors to be the total taxable value of land and additions on the property. | Land | Improvement |
|---|---|---|---|---|
| 2025 | $11,917 | $871,180 | $696,950 | $174,230 |
| 2024 | $11,917 | $854,099 | $683,285 | $170,814 |
| 2023 | $11,825 | $837,353 | $669,888 | $167,465 |
| 2022 | $11,701 | $820,935 | $656,753 | $164,182 |
| 2021 | $11,465 | $804,839 | $643,876 | $160,963 |
| 2020 | $10,944 | $796,587 | $637,274 | $159,313 |
| 2019 | $10,808 | $780,969 | $624,779 | $156,190 |
| 2018 | $10,512 | $765,657 | $612,529 | $153,128 |
| 2017 | $10,311 | $750,645 | $600,519 | $150,126 |
| 2016 | $9,822 | $735,928 | $588,745 | $147,183 |
| 2015 | $9,705 | $724,875 | $579,902 | $144,973 |
| 2014 | $9,134 | $710,677 | $568,543 | $142,134 |
Source: Public Records
Map
Nearby Homes
- 2264 Shelley Ave
- 3461 Wine Cask Way
- 3489 Wine Barrel Way
- 3659 S Bascom Ave
- 116 Monte Villa Ct
- 3949 Starview Dr
- 201 Shelley Ave
- 4593 Fallstone Ct
- 2088 Cully Place
- 101 Redding Rd Unit A4
- 1040 Longfellow Ave
- 14566 S Bascom Ave
- 2309 Saidel Dr Unit 2
- 1500 Camden Ave
- 2303 Saidel Dr Unit 4
- 4768 Hatfield Walk Unit 2
- 2985 Lantz Ave
- 4787 Hatfield Walkway Unit 4
- 2265 Sun Glory Ln Unit A
- 3335 Jennifer Way
- 2265 Starbright Dr
- 2255 Starbright Dr
- 2256 Woodard Rd
- 15534 Woodard Rd
- 2260 Starbright Dr
- 3703 Jacksol Dr
- 2271 Starbright Dr
- 2264 Starbright Dr
- 2254 Starbright Dr
- 15550 Woodard Rd
- 2270 Starbright Dr
- 2259 Stratford Dr
- 15560 Woodard Rd
- 2275 Starbright Dr
- 2263 Stratford Dr
- 2253 Stratford Dr
- 14376 Jacksol Dr
- 14388 Jacksol Dr
- 2274 Starbright Dr
- 14364 Jacksol Dr