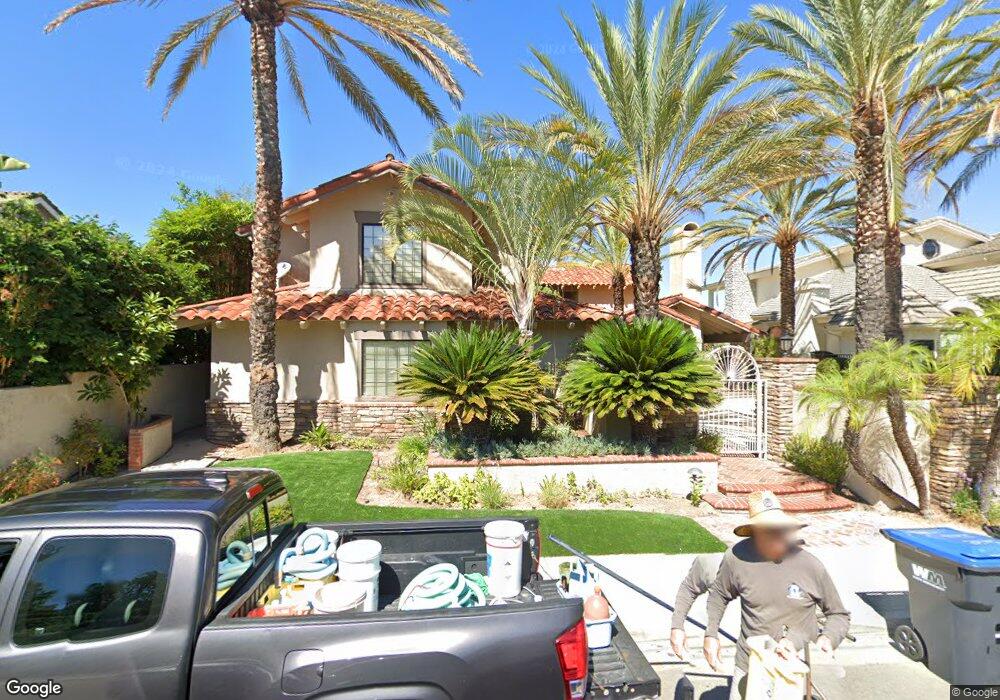
22611 Tindaya Unit 1 Mission Viejo, CA 92692
Estimated Value: $2,576,000 - $3,848,000
5
Beds
4
Baths
3,704
Sq Ft
$889/Sq Ft
Est. Value
About This Home
This home is located at 22611 Tindaya Unit 1, Mission Viejo, CA 92692 and is currently estimated at $3,291,268, approximately $888 per square foot. 22611 Tindaya Unit 1 is a home located in Orange County with nearby schools including Philip J. Reilly Elementary, Newhart Middle School, and Capistrano Valley High School.
Ownership History
Date
Name
Owned For
Owner Type
Purchase Details
Closed on
Nov 12, 2020
Sold by
Badrtalei Jeffer S and Badrtalei Susan K
Bought by
Badrtalei Jeffer S and Badrtalei Susan K
Current Estimated Value
Purchase Details
Closed on
Sep 14, 2016
Sold by
Abuelafiya Riad R and Abuelafiya Mary S
Bought by
Badrtalei Jeffer S and Badrtalei Susan K
Home Financials for this Owner
Home Financials are based on the most recent Mortgage that was taken out on this home.
Original Mortgage
$1,100,000
Interest Rate
3.12%
Mortgage Type
Adjustable Rate Mortgage/ARM
Purchase Details
Closed on
Jun 20, 2001
Sold by
Robertson Douglas Thomas and Robertson Janine Burchelle
Bought by
Abuelafiya Riad R and Abuelafiya Mary S
Home Financials for this Owner
Home Financials are based on the most recent Mortgage that was taken out on this home.
Original Mortgage
$717,500
Interest Rate
6.62%
Create a Home Valuation Report for This Property
The Home Valuation Report is an in-depth analysis detailing your home's value as well as a comparison with similar homes in the area
Home Values in the Area
Average Home Value in this Area
Purchase History
| Date | Buyer | Sale Price | Title Company |
|---|---|---|---|
| Badrtalei Jeffer S | -- | None Available | |
| Badrtalei Jeffer S | $2,300,000 | Ort Irvine | |
| Abuelafiya Riad R | $1,025,000 | -- |
Source: Public Records
Mortgage History
| Date | Status | Borrower | Loan Amount |
|---|---|---|---|
| Previous Owner | Badrtalei Jeffer S | $1,100,000 | |
| Previous Owner | Abuelafiya Riad R | $717,500 |
Source: Public Records
Tax History Compared to Growth
Tax History
| Year | Tax Paid | Tax Assessment Tax Assessment Total Assessment is a certain percentage of the fair market value that is determined by local assessors to be the total taxable value of land and additions on the property. | Land | Improvement |
|---|---|---|---|---|
| 2025 | $26,304 | $2,669,345 | $2,034,147 | $635,198 |
| 2024 | $26,304 | $2,617,005 | $1,994,261 | $622,744 |
| 2023 | $25,697 | $2,565,692 | $1,955,158 | $610,534 |
| 2022 | $25,192 | $2,515,385 | $1,916,822 | $598,563 |
| 2021 | $24,696 | $2,466,064 | $1,879,237 | $586,827 |
| 2020 | $24,443 | $2,440,778 | $1,859,968 | $580,810 |
| 2019 | $23,962 | $2,392,920 | $1,823,498 | $569,422 |
| 2018 | $23,491 | $2,346,000 | $1,787,743 | $558,257 |
| 2017 | $23,029 | $2,300,000 | $1,752,689 | $547,311 |
| 2016 | $13,353 | $1,328,804 | $765,934 | $562,870 |
| 2015 | $14,364 | $1,308,845 | $754,429 | $554,416 |
| 2014 | $14,106 | $1,283,207 | $739,651 | $543,556 |
Source: Public Records
Map
Nearby Homes
- 22691 Lajares
- 22685 Barlovento
- 22791 Tindaya
- 22506 Formentor Unit 13
- 22312 Wayside
- 22422 Porreras Unit 7
- 22402 Valdemosa Unit 19
- 22396 Estallens Unit 56
- 27782 Soller Unit 39
- 22541 Wakefield
- 12 Ashton
- 27662 Esla
- 22681 Maplewood
- 22068 Antigua
- 28222 Alava
- 22121 Cherrywood
- 27913 Trocadero Unit 68
- 28401 Alava
- 23232 El Greco
- 27879 Chipiona Unit 52
- 22611 Tindaya
- 22601 Tindaya
- 28151 San Lucas
- 28141 San Lucas
- 28131 San Lucas
- 22581 Tindaya
- 28121 San Lucas
- 22571 Tindaya
- 28111 San Lucas
- 22631 Puntal Lana
- 22621 Puntal Lana
- 22641 Puntal Lana
- 22611 Puntal Lana
- 22551 Tindaya
- 28142 San Lucas
- 22651 Puntal Lana
- 28132 San Lucas
- 22601 Puntal Lana
- 28105 San Lucas
- 28122 San Lucas