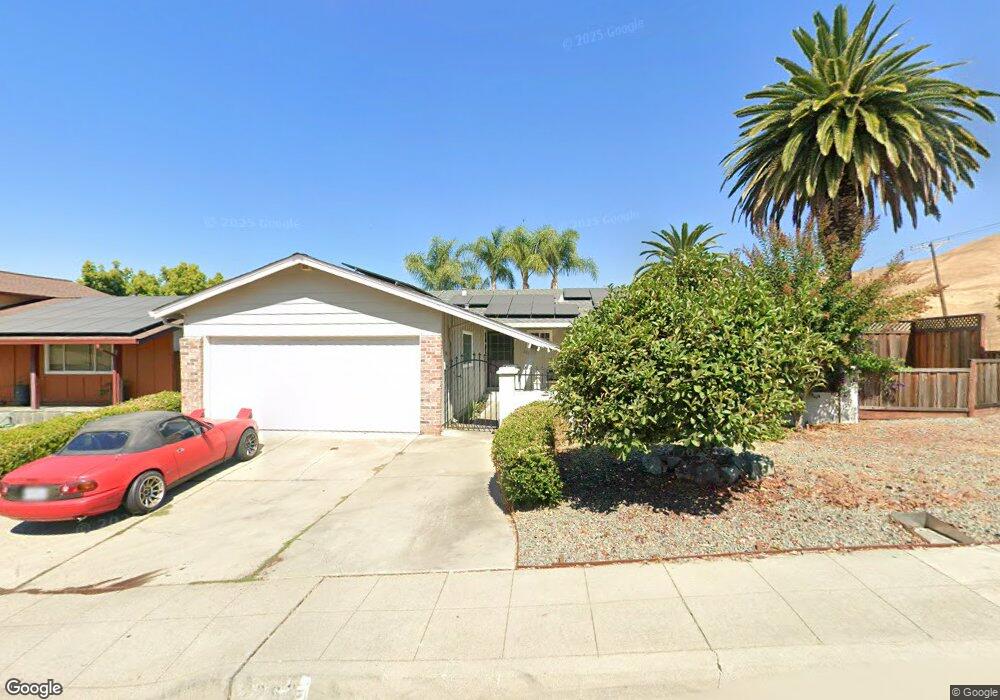
2263 Seacliff Dr Milpitas, CA 95035
Estimated Value: $1,475,000 - $1,800,000
3
Beds
2
Baths
1,264
Sq Ft
$1,317/Sq Ft
Est. Value
About This Home
This home is located at 2263 Seacliff Dr, Milpitas, CA 95035 and is currently estimated at $1,664,356, approximately $1,316 per square foot. 2263 Seacliff Dr is a home located in Santa Clara County with nearby schools including John Sinnott Elementary School, Rancho Milpitas Middle School, and Milpitas High School.
Ownership History
Date
Name
Owned For
Owner Type
Purchase Details
Closed on
Sep 18, 2013
Sold by
Vo Rang and Tran Lien
Bought by
Vo Rang and Tran Lien
Current Estimated Value
Home Financials for this Owner
Home Financials are based on the most recent Mortgage that was taken out on this home.
Original Mortgage
$492,000
Outstanding Balance
$368,016
Interest Rate
4.46%
Mortgage Type
New Conventional
Estimated Equity
$1,296,340
Purchase Details
Closed on
Aug 23, 2007
Sold by
Nguyen Ryan and Nguyen Jessica D
Bought by
Vo Rang and Tran Lien
Home Financials for this Owner
Home Financials are based on the most recent Mortgage that was taken out on this home.
Original Mortgage
$536,000
Interest Rate
6.74%
Mortgage Type
New Conventional
Purchase Details
Closed on
Jun 12, 2007
Sold by
Nguyen Ryan
Bought by
Nguyen Ryan and Nguyen Jessica D
Purchase Details
Closed on
Jul 14, 1998
Sold by
Nguyen Dao
Bought by
Nguyen Ryan
Purchase Details
Closed on
Jul 7, 1998
Sold by
Nguyen Dao
Bought by
Nguyen Ryan
Create a Home Valuation Report for This Property
The Home Valuation Report is an in-depth analysis detailing your home's value as well as a comparison with similar homes in the area
Home Values in the Area
Average Home Value in this Area
Purchase History
| Date | Buyer | Sale Price | Title Company |
|---|---|---|---|
| Vo Rang | -- | Chicago Title Company | |
| Vo Rang | $670,000 | Financial Title Company | |
| Nguyen Ryan | -- | Alliance Title Company | |
| Nguyen Ryan | -- | Stewart Title | |
| Nguyen Ryan | -- | Stewart Title |
Source: Public Records
Mortgage History
| Date | Status | Borrower | Loan Amount |
|---|---|---|---|
| Open | Vo Rang | $492,000 | |
| Closed | Vo Rang | $536,000 |
Source: Public Records
Tax History Compared to Growth
Tax History
| Year | Tax Paid | Tax Assessment Tax Assessment Total Assessment is a certain percentage of the fair market value that is determined by local assessors to be the total taxable value of land and additions on the property. | Land | Improvement |
|---|---|---|---|---|
| 2025 | $10,050 | $880,043 | $616,033 | $264,010 |
| 2024 | $10,050 | $862,788 | $603,954 | $258,834 |
| 2023 | $10,017 | $845,871 | $592,112 | $253,759 |
| 2022 | $9,975 | $829,286 | $580,502 | $248,784 |
| 2021 | $9,830 | $813,026 | $569,120 | $243,906 |
| 2020 | $9,658 | $804,691 | $563,285 | $241,406 |
| 2019 | $9,547 | $788,914 | $552,241 | $236,673 |
| 2018 | $9,064 | $773,446 | $541,413 | $232,033 |
| 2017 | $8,947 | $758,282 | $530,798 | $227,484 |
| 2016 | $8,116 | $702,000 | $491,400 | $210,600 |
| 2015 | $7,777 | $669,000 | $468,300 | $200,700 |
| 2014 | $7,320 | $634,000 | $443,800 | $190,200 |
Source: Public Records
Map
Nearby Homes
- 2327 Farmcrest St
- 3352 Landess Ave Unit D
- 3544 Madrid Dr
- 2113 Uridias Ranch Rd
- 1612 Tahoe Dr
- 1536 Sonoma Dr
- 3555 Laurant Way
- 1710 Clear Lake Ave
- 1501 Canton Dr
- 17 Terfidia Ln
- 2085 Ashwood Ln
- 1209 Glacier Dr
- 3139 Laneview Dr
- 1195 Acadia Ave
- 496 Dempsey Rd Unit 199
- 484 Dempsey Rd Unit 185
- 3248 Woody Ln
- 3252 Cropley Ave
- 3211 Parkhaven Dr
- 3437 Duchess Ct
- 2251 Seacliff Dr
- 2264 Shiloh Ave
- 2252 Shiloh Ave
- 2239 Seacliff Dr
- 2266 Seacliff Dr
- 2240 Shiloh Ave
- 2254 Seacliff Dr
- 2227 Seacliff Dr
- 2242 Seacliff Dr
- 2228 Shiloh Ave
- 2230 Seacliff Dr
- 2269 Shiloh Ave
- 2215 Seacliff Dr
- 2257 Shiloh Ave
- 2353 Glenview Dr
- 2216 Shiloh Ave
- 2245 Shiloh Ave
- 2341 Glenview Dr
- 2218 Seacliff Dr
- 2233 Shiloh Ave