Estimated Value: $138,957 - $160,000
3
Beds
2
Baths
1,456
Sq Ft
$103/Sq Ft
Est. Value
About This Home
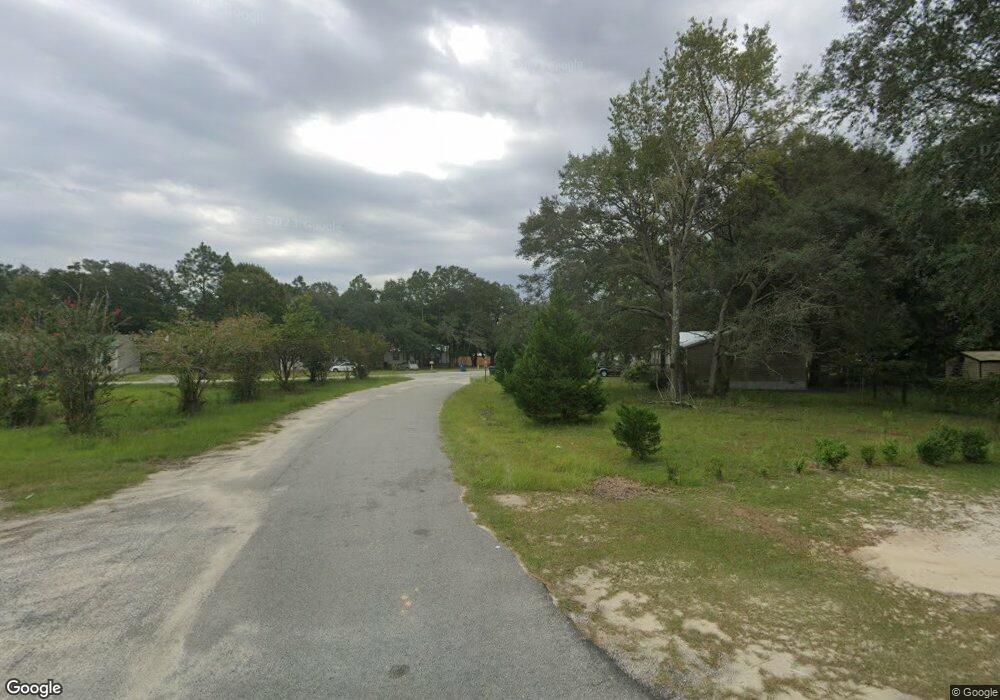
This home is located at 227 E Shellcracker Rd, Jesup, GA 31545 and is currently estimated at $149,489, approximately $102 per square foot. 227 E Shellcracker Rd is a home located in Wayne County with nearby schools including Jesup Elementary School, Arthur Williams Middle School, and Wayne County High School.
Ownership History
Date
Name
Owned For
Owner Type
Purchase Details
Closed on
May 26, 2022
Sold by
S And B Properties Llc
Bought by
Lamb Kenyon Vance
Current Estimated Value
Purchase Details
Closed on
Oct 18, 2018
Sold by
Rogers Demont
Bought by
S And B Properties Llc
Purchase Details
Closed on
Jul 19, 2018
Sold by
Regions Bank
Bought by
Rogers Demont
Purchase Details
Closed on
Jan 14, 2016
Sold by
Federal National Mortgage Association
Bought by
Regions Bank
Purchase Details
Closed on
Apr 7, 2015
Sold by
Regions Bank
Bought by
Federal National Mtg Associati
Purchase Details
Closed on
Mar 1, 2003
Sold by
Poppell Ricky R
Bought by
Canaan Land Properties Inc
Purchase Details
Closed on
Nov 1, 2002
Bought by
Poppell Ricky R
Purchase Details
Closed on
Sep 1, 2002
Purchase Details
Closed on
Aug 1, 2002
Purchase Details
Closed on
Jun 1, 2001
Purchase Details
Closed on
Jul 1, 1974
Purchase Details
Closed on
May 1, 1971
Create a Home Valuation Report for This Property
The Home Valuation Report is an in-depth analysis detailing your home's value as well as a comparison with similar homes in the area
Purchase History
| Date | Buyer | Sale Price | Title Company |
|---|---|---|---|
| Lamb Kenyon Vance | $290,000 | -- | |
| S And B Properties Llc | -- | -- | |
| Rogers Demont | $16,500 | -- | |
| Regions Bank | -- | -- | |
| Federal National Mtg Associati | -- | -- | |
| Regions Bank | -- | -- | |
| Canaan Land Properties Inc | -- | -- | |
| Poppell Ricky R | $85,000 | -- | |
| -- | -- | -- | |
| -- | -- | -- | |
| -- | -- | -- | |
| -- | -- | -- | |
| -- | -- | -- |
Source: Public Records
Tax History
| Year | Tax Paid | Tax Assessment Tax Assessment Total Assessment is a certain percentage of the fair market value that is determined by local assessors to be the total taxable value of land and additions on the property. | Land | Improvement |
|---|---|---|---|---|
| 2025 | $596 | $21,632 | $1,600 | $20,032 |
| 2024 | $555 | $20,954 | $1,600 | $19,354 |
| 2023 | $511 | $18,535 | $1,600 | $16,935 |
| 2022 | $477 | $15,148 | $1,600 | $13,548 |
| 2021 | $486 | $14,404 | $1,600 | $12,804 |
| 2020 | $503 | $14,404 | $1,600 | $12,804 |
| 2019 | $237 | $14,404 | $1,600 | $12,804 |
| 2018 | $518 | $14,429 | $1,600 | $12,829 |
| 2017 | $432 | $14,429 | $1,600 | $12,829 |
| 2016 | $432 | $14,429 | $1,600 | $12,829 |
| 2014 | -- | $14,429 | $1,600 | $12,829 |
| 2013 | -- | $14,429 | $1,600 | $12,829 |
Source: Public Records
Map
Nearby Homes
- 492 Doctortown Rd
- 80 Snapper Rd
- 93 Thrasher Ln E
- 94 Thrasher Ln E
- 0 Oak St
- 105 Stardust Loop
- 196 Barn Road Cir
- 105 N Bay St
- 86 Barn Road Cir
- 1 Altamaha Rd
- 0 Savannah Hwy Unit 166890
- 500 Altamaha Rd
- 2 Altamaha Rd
- 142 Lloyd Dr
- 3735 Savannah Hwy
- 888 Altamaha Rd
- 629 Sierra Rd
- 2606 Beechwood Dr
- 0000 Lakeview Dr
- 00 Lakeview Dr
- 199 E Shellcracker Rd
- 176 W Shellcracker Rd
- 156 W Shellcracker Rd
- 136 W Shellcracker Rd
- 182 E Shellcracker Rd
- 182 E Shellcracker Rd
- 196 E Shellcracker Rd
- 162 E Shellcracker Rd
- 137 W Shellcracker Rd
- 117 W Shellcracker Rd
- 142 E Shellcracker Rd
- 214 Snapper Rd
- 292 E Shellcracker Rd
- 174 Snapper Rd
- 101 E Shellcracker Rd
- 312 E Shellcracker Rd
- 377 Croaker Rd
- 309 E Shellcracker Rd
- 357 Croaker Rd
- 0 Snapper Rd Unit 147134
Your Personal Tour Guide
Ask me questions while you tour the home.