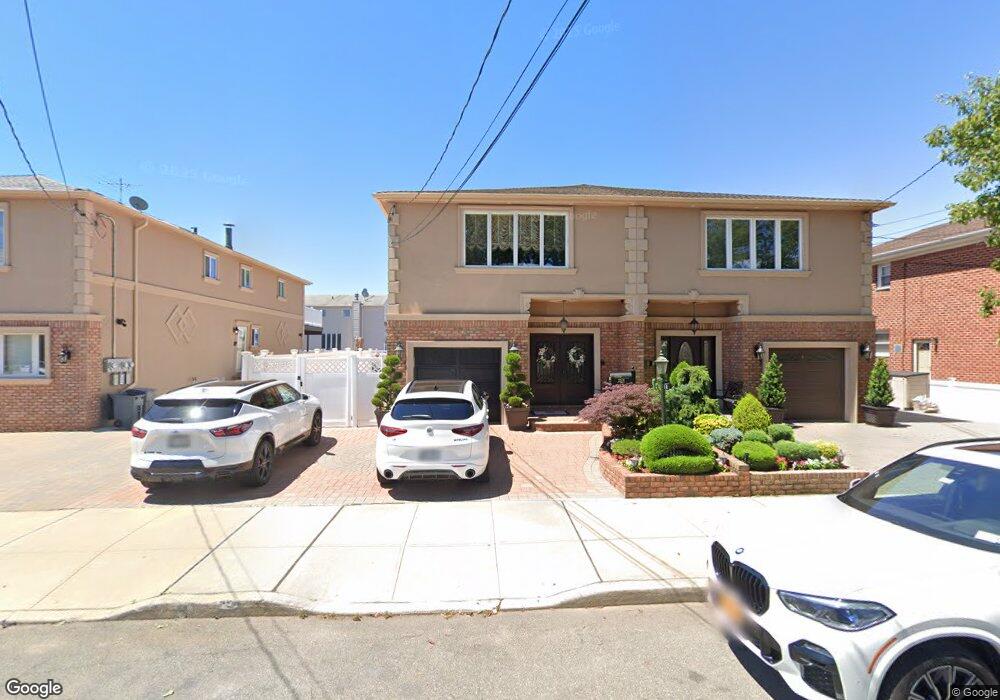
2272 E 71st St Brooklyn, NY 11234
Bergen Beach NeighborhoodEstimated Value: $766,041 - $1,385,000
Studio
--
Bath
1,900
Sq Ft
$538/Sq Ft
Est. Value
About This Home
This home is located at 2272 E 71st St, Brooklyn, NY 11234 and is currently estimated at $1,022,510, approximately $538 per square foot. 2272 E 71st St is a home located in Kings County with nearby schools including P.S. 312 Bergen Beach, James Madison High School, and Success Academy Charter School - Bergen Beach.
Ownership History
Date
Name
Owned For
Owner Type
Purchase Details
Closed on
Oct 14, 2011
Sold by
Camarda Marie
Bought by
Capalbo Andrea and Capalbo Vincent A
Current Estimated Value
Home Financials for this Owner
Home Financials are based on the most recent Mortgage that was taken out on this home.
Original Mortgage
$300,000
Outstanding Balance
$204,710
Interest Rate
4.11%
Mortgage Type
Purchase Money Mortgage
Estimated Equity
$817,800
Create a Home Valuation Report for This Property
The Home Valuation Report is an in-depth analysis detailing your home's value as well as a comparison with similar homes in the area
Home Values in the Area
Average Home Value in this Area
Purchase History
| Date | Buyer | Sale Price | Title Company |
|---|---|---|---|
| Capalbo Andrea | $600,000 | -- |
Source: Public Records
Mortgage History
| Date | Status | Borrower | Loan Amount |
|---|---|---|---|
| Open | Capalbo Andrea | $300,000 |
Source: Public Records
Tax History
| Year | Tax Paid | Tax Assessment Tax Assessment Total Assessment is a certain percentage of the fair market value that is determined by local assessors to be the total taxable value of land and additions on the property. | Land | Improvement |
|---|---|---|---|---|
| 2025 | $8,146 | $42,540 | $13,500 | $29,040 |
| 2024 | $8,146 | $40,560 | $13,500 | $27,060 |
| 2023 | $9,125 | $45,360 | $13,500 | $31,860 |
| 2022 | $8,462 | $48,300 | $13,500 | $34,800 |
| 2021 | $8,416 | $45,840 | $13,500 | $32,340 |
| 2020 | $3,947 | $42,600 | $13,500 | $29,100 |
| 2019 | $7,892 | $40,020 | $13,500 | $26,520 |
| 2018 | $7,633 | $37,444 | $10,249 | $27,195 |
| 2017 | $7,201 | $35,325 | $10,269 | $25,056 |
| 2016 | $6,662 | $33,326 | $10,804 | $22,522 |
| 2015 | $4,663 | $31,440 | $15,000 | $16,440 |
| 2014 | $4,663 | $31,440 | $15,000 | $16,440 |
Source: Public Records
Map
Nearby Homes
- 2233 E 72nd St
- 2239 E 70th St
- 2248 E 70th St
- 2246 E 70th St
- 2172 E 72nd St
- 7417 Avenue W
- 2134 E 74th St Unit 2138
- 2310 Bergen Ave
- 2150 Royce St
- 2115 E 70th St
- 2102 E 73rd St
- 2346 Bergen Ave
- 2427 E 72nd St
- 2447 E 71st St
- 2063 E 71st St
- 2078 Bergen Ave
- 2072 E 68th St
- 2026 E 74th St
- 2017 E 71st St
- 2008 E 72nd St
Your Personal Tour Guide
Ask me questions while you tour the home.