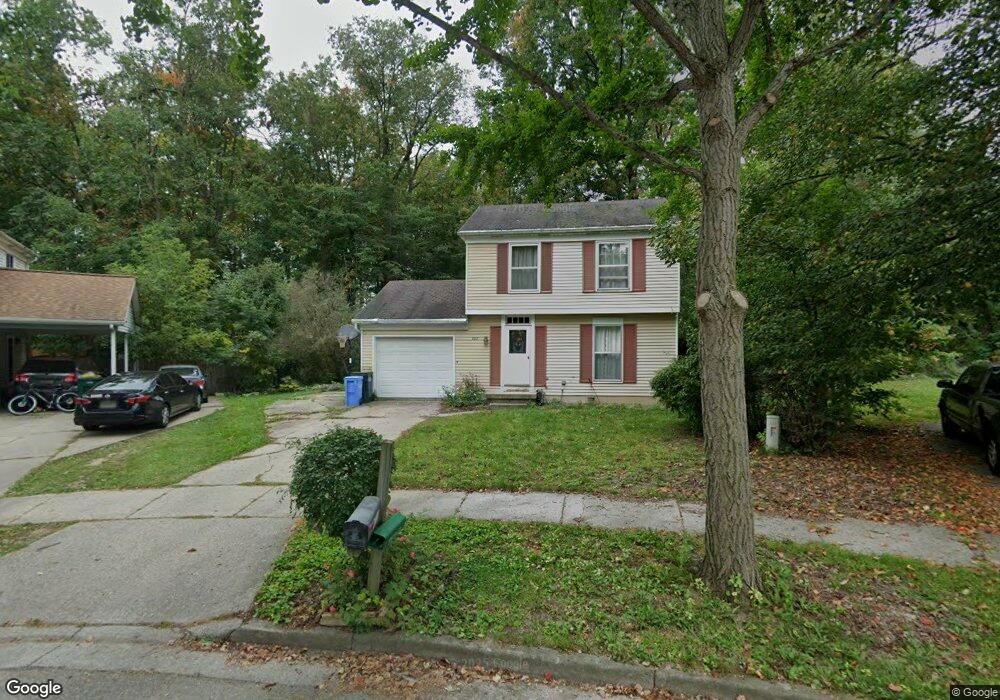
228 Trinity Cir Lansing, MI 48911
Southern Lansing NeighborhoodEstimated Value: $141,856 - $178,000
Studio
1
Bath
1,035
Sq Ft
$163/Sq Ft
Est. Value
About This Home
This home is located at 228 Trinity Cir, Lansing, MI 48911 and is currently estimated at $168,214, approximately $162 per square foot. 228 Trinity Cir is a home located in Ingham County with nearby schools including Kendon School, Attwood School, and Everett High School.
Ownership History
Date
Name
Owned For
Owner Type
Purchase Details
Closed on
Sep 30, 2017
Sold by
Harris Yvonne
Bought by
Harris Yvette
Current Estimated Value
Purchase Details
Closed on
Sep 6, 2002
Sold by
Tacey Holly J and Tacey Adam D
Bought by
Harris Yvonne
Home Financials for this Owner
Home Financials are based on the most recent Mortgage that was taken out on this home.
Original Mortgage
$118,750
Outstanding Balance
$49,968
Interest Rate
6.34%
Mortgage Type
Purchase Money Mortgage
Estimated Equity
$118,246
Purchase Details
Closed on
Oct 31, 2001
Sold by
Davis Carol L
Bought by
Ruble Holly J and Tacey Adam D
Home Financials for this Owner
Home Financials are based on the most recent Mortgage that was taken out on this home.
Original Mortgage
$112,100
Interest Rate
6.5%
Mortgage Type
Purchase Money Mortgage
Purchase Details
Closed on
Feb 1, 1997
Sold by
Wentland Jennifer L
Bought by
Davis Carol L
Create a Home Valuation Report for This Property
The Home Valuation Report is an in-depth analysis detailing your home's value as well as a comparison with similar homes in the area
Home Values in the Area
Average Home Value in this Area
Purchase History
| Date | Buyer | Sale Price | Title Company |
|---|---|---|---|
| Harris Yvette | -- | None Available | |
| Harris Yvonne | $125,000 | -- | |
| Ruble Holly J | $118,000 | Midstate Title Company | |
| Davis Carol L | $73,000 | -- |
Source: Public Records
Mortgage History
| Date | Status | Borrower | Loan Amount |
|---|---|---|---|
| Open | Harris Yvonne | $118,750 | |
| Previous Owner | Ruble Holly J | $112,100 |
Source: Public Records
Tax History
| Year | Tax Paid | Tax Assessment Tax Assessment Total Assessment is a certain percentage of the fair market value that is determined by local assessors to be the total taxable value of land and additions on the property. | Land | Improvement |
|---|---|---|---|---|
| 2025 | $3,294 | $69,300 | $11,100 | $58,200 |
| 2024 | $26 | $61,900 | $11,100 | $50,800 |
| 2023 | $3,088 | $58,500 | $11,100 | $47,400 |
| 2022 | $2,783 | $52,000 | $9,500 | $42,500 |
| 2021 | $2,726 | $49,400 | $8,000 | $41,400 |
| 2020 | $2,709 | $46,000 | $8,000 | $38,000 |
| 2019 | $2,597 | $43,200 | $8,000 | $35,200 |
| 2018 | $2,433 | $40,400 | $8,000 | $32,400 |
| 2017 | $1,972 | $40,400 | $8,000 | $32,400 |
| 2016 | $1,887 | $35,600 | $8,000 | $27,600 |
| 2015 | $1,887 | $33,800 | $15,912 | $17,888 |
| 2014 | $1,887 | $33,300 | $22,913 | $10,387 |
Source: Public Records
Map
Nearby Homes
- 125 E Northrup St
- 208 E Northrup St
- 115 E Claremore Dr
- 5267 Crocus Ave
- 205 E Jolly Rd Unit 6
- 419 W Jolly Rd
- 5009 Kessler Dr
- 201 E Syringa Dr
- 5008 Southgate Ave
- 826 R G Curtiss Ave
- 6246 Gardenia Ave
- 111 E Potter Ave
- 221 W Everettdale Ave
- 4926 Burchfield Ave
- 4907 Burchfield Ave
- 1115 Shirley St
- 1109 Barr Ave
- 1020 R G Curtiss Ave
- 4719 S Pennsylvania Ave
- 6429 Rosedale Rd
Your Personal Tour Guide
Ask me questions while you tour the home.