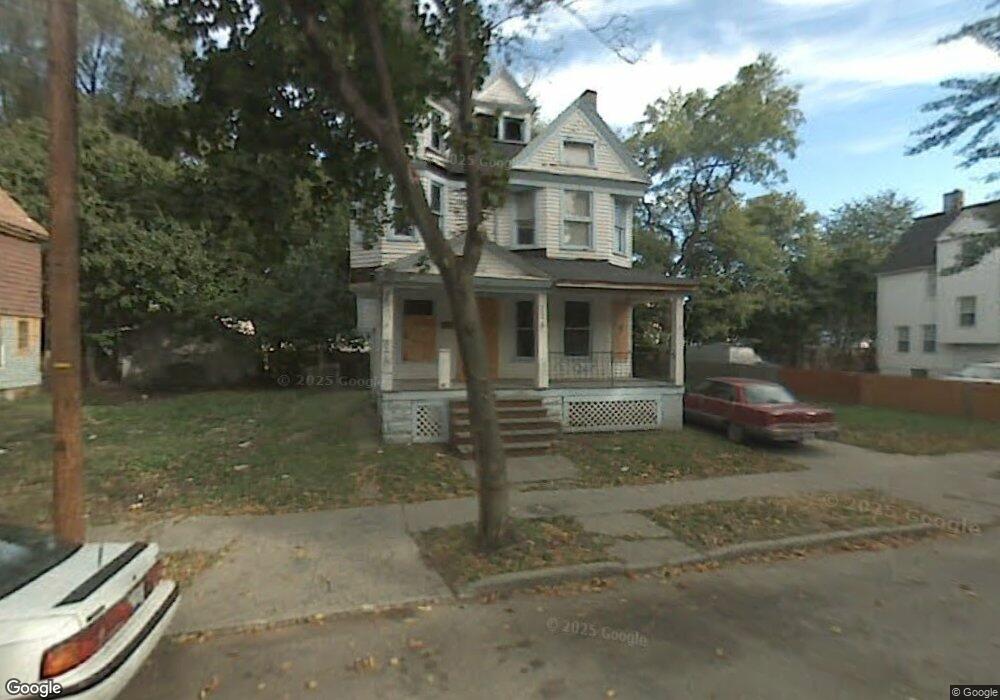
2287 E 95th St Cleveland, OH 44106
Fairfax NeighborhoodEstimated Value: $30,000 - $219,000
6
Beds
1
Bath
1,744
Sq Ft
$67/Sq Ft
Est. Value
About This Home
This home is located at 2287 E 95th St, Cleveland, OH 44106 and is currently estimated at $117,057, approximately $67 per square foot. 2287 E 95th St is a home located in Cuyahoga County with nearby schools including The Intergenerational School and St. Adalbert Catholic School.
Ownership History
Date
Name
Owned For
Owner Type
Purchase Details
Closed on
May 7, 2010
Sold by
Jelrei Properties Llc
Bought by
Rosales Daniel C
Current Estimated Value
Purchase Details
Closed on
Mar 5, 2007
Sold by
Cleveland Renovation Group Llc
Bought by
Jelrei Properties Llc
Purchase Details
Closed on
Jun 13, 2005
Sold by
Countrywide Home Loans Inc
Bought by
Cleveland Renovation Group
Purchase Details
Closed on
May 31, 2005
Sold by
Cobbins Mattie
Bought by
Countrywide Home Loans Inc
Purchase Details
Closed on
Jun 14, 1988
Sold by
Atkinson Anna
Bought by
Cobbins Simmon
Purchase Details
Closed on
Mar 19, 1982
Sold by
Watson Naomi
Bought by
Atkinson Anna
Purchase Details
Closed on
Feb 1, 1982
Sold by
Brown Lloyd
Bought by
Watson Naomi
Purchase Details
Closed on
Jan 1, 1975
Bought by
Brown Lloyd
Create a Home Valuation Report for This Property
The Home Valuation Report is an in-depth analysis detailing your home's value as well as a comparison with similar homes in the area
Home Values in the Area
Average Home Value in this Area
Purchase History
| Date | Buyer | Sale Price | Title Company |
|---|---|---|---|
| Rosales Daniel C | $3,000 | City Title Agency | |
| Jelrei Properties Llc | -- | None Available | |
| Cleveland Renovation Group | $15,000 | Resource Title Agency | |
| Countrywide Home Loans Inc | $33,999 | Resource Title Agency | |
| Cobbins Simmon | $8,000 | -- | |
| Atkinson Anna | -- | -- | |
| Watson Naomi | -- | -- | |
| Brown Lloyd | -- | -- |
Source: Public Records
Tax History
| Year | Tax Paid | Tax Assessment Tax Assessment Total Assessment is a certain percentage of the fair market value that is determined by local assessors to be the total taxable value of land and additions on the property. | Land | Improvement |
|---|---|---|---|---|
| 2025 | $1,242 | $18,550 | $3,045 | $15,505 |
| 2024 | $1,241 | $18,550 | $3,045 | $15,505 |
| 2023 | $461 | $5,950 | $1,610 | $4,340 |
| 2022 | $459 | $5,950 | $1,610 | $4,340 |
| 2021 | $454 | $5,950 | $1,610 | $4,340 |
| 2020 | $489 | $5,530 | $1,510 | $4,030 |
| 2019 | $453 | $15,800 | $4,300 | $11,500 |
| 2018 | $358 | $5,530 | $1,510 | $4,030 |
| 2017 | $266 | $3,150 | $840 | $2,310 |
| 2016 | $264 | $3,150 | $840 | $2,310 |
| 2015 | $254 | $3,150 | $840 | $2,310 |
| 2014 | $254 | $3,020 | $810 | $2,210 |
Source: Public Records
Map
Nearby Homes
- 2296 E 97th St
- 2288 E 95th St
- 2314 E 95th St
- 2294 E 100th St
- 2230 E 97th St
- 2311 E 100th St
- 2315 E 100th St
- 2319 E 100th St
- 2291 E 90th St
- 9918 Quebec Ave
- 2202 E 100th St
- 2292 E 90th St
- 2321 E 101st St
- 2206 E 93rd St
- 2240 E 90th St
- 2183 E 95th St
- 2179 E 93rd St
- 2245 E 87th St
- 2351 E 86th St
- 2355 E 86th St
Your Personal Tour Guide
Ask me questions while you tour the home.