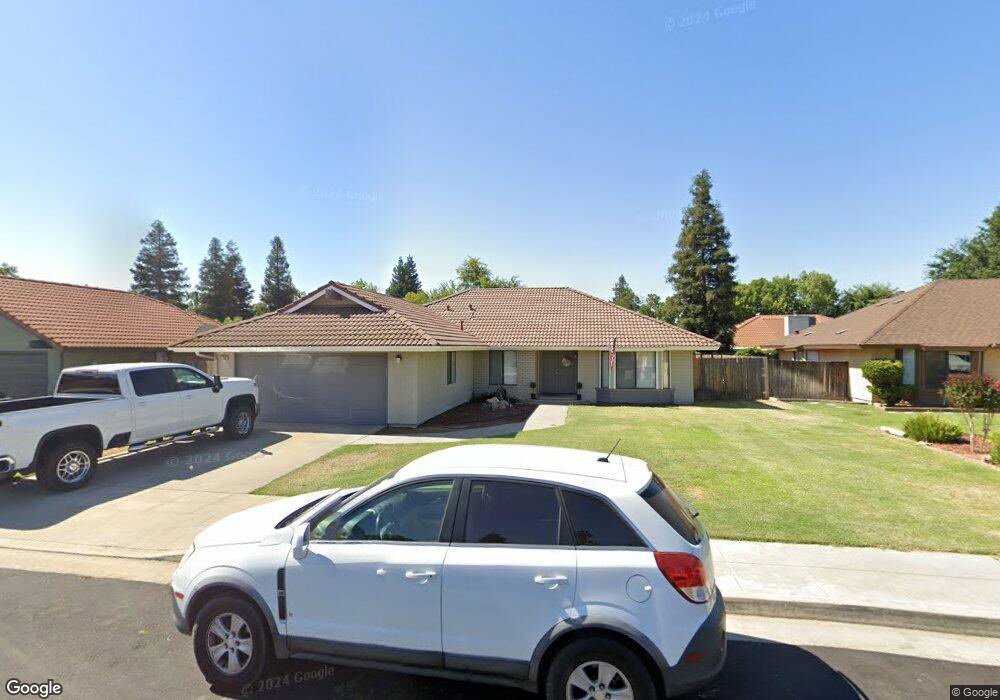
2288 Mitchell Ave Clovis, CA 93611
Estimated Value: $426,152 - $464,000
3
Beds
2
Baths
1,676
Sq Ft
$264/Sq Ft
Est. Value
About This Home
This home is located at 2288 Mitchell Ave, Clovis, CA 93611 and is currently estimated at $442,051, approximately $263 per square foot. 2288 Mitchell Ave is a home located in Fresno County with nearby schools including Clovis Elementary School, Clark Intermediate School, and Clovis High School.
Ownership History
Date
Name
Owned For
Owner Type
Purchase Details
Closed on
Aug 21, 2024
Sold by
Gleason James J
Bought by
Gleason James J and Spence Timony
Current Estimated Value
Purchase Details
Closed on
Jun 25, 2003
Sold by
Matthews Patricia D
Bought by
Gleason James J
Purchase Details
Closed on
Jun 10, 2002
Sold by
Kendrick Eugene Forrest and Schildknecht Sharron Annette
Bought by
Gleason James J and Matthews Patricia D
Home Financials for this Owner
Home Financials are based on the most recent Mortgage that was taken out on this home.
Original Mortgage
$148,108
Interest Rate
6.74%
Mortgage Type
FHA
Purchase Details
Closed on
Sep 14, 2001
Sold by
Kendrick Eugene Forrest and Schildknecht Sharron Annette
Bought by
Kendrick Eugene Forrest and Schildknecht Sharron Annette
Purchase Details
Closed on
Mar 9, 1994
Sold by
Kendrick Macklin F and Kendrick Estella K
Bought by
Kendrick Macklin F and Kendrick Estella Gott
Create a Home Valuation Report for This Property
The Home Valuation Report is an in-depth analysis detailing your home's value as well as a comparison with similar homes in the area
Home Values in the Area
Average Home Value in this Area
Purchase History
| Date | Buyer | Sale Price | Title Company |
|---|---|---|---|
| Gleason James J | -- | -- | |
| Gleason James J | -- | -- | |
| Gleason James J | $152,000 | Fidelity National Title Co | |
| Kendrick Eugene Forrest | -- | -- | |
| Kendrick Macklin F | -- | -- | |
| Kendrick Macklin F | -- | -- |
Source: Public Records
Mortgage History
| Date | Status | Borrower | Loan Amount |
|---|---|---|---|
| Previous Owner | Gleason James J | $148,108 |
Source: Public Records
Tax History
| Year | Tax Paid | Tax Assessment Tax Assessment Total Assessment is a certain percentage of the fair market value that is determined by local assessors to be the total taxable value of land and additions on the property. | Land | Improvement |
|---|---|---|---|---|
| 2025 | $2,927 | $240,210 | $75,878 | $164,332 |
| 2023 | $2,804 | $230,884 | $72,933 | $157,951 |
| 2022 | $2,767 | $226,357 | $71,503 | $154,854 |
| 2021 | $2,692 | $221,919 | $70,101 | $151,818 |
| 2020 | $2,682 | $219,645 | $69,383 | $150,262 |
| 2019 | $2,631 | $215,339 | $68,023 | $147,316 |
| 2018 | $2,576 | $211,118 | $66,690 | $144,428 |
| 2017 | $2,520 | $206,980 | $65,383 | $141,597 |
| 2016 | $2,438 | $202,922 | $64,101 | $138,821 |
| 2015 | $2,402 | $199,875 | $63,139 | $136,736 |
| 2014 | $2,358 | $195,961 | $61,903 | $134,058 |
Source: Public Records
Map
Nearby Homes
- 937 Filbert Ave
- 2518 Keats Ave
- 2549 Purvis Ave
- 1895 Dennis Ave
- 1584 Laverne Ave
- 2034 Wrenwood Ave
- 1876 Cougar Ln
- 2337 Wrenwood Ave
- 865 McKelvy Ave
- 2668 Scott Ave
- 3497 Shaw Ave
- 1334 Shirley Ave
- 2020 Hanson Ave
- 1721 Beverly Ave
- 1273 Bundy Ave
- 860 Mcarthur Ave
- 2681 Wrenwood Ave
- 793 Applegate Ave
- 1946 Calimyrna Ave
- 2782 Poe Ave
- 2314 Mitchell Ave
- 2264 Mitchell Ave
- 2313 Dennis Ave
- 2287 Dennis Ave
- 2337 Dennis Ave
- 2238 Mitchell Ave
- 2275 Mitchell Ave
- 2245 Mitchell Ave
- 2263 Dennis Ave
- 2315 Mitchell Ave
- 2215 Mitchell Ave
- 2345 Mitchell Ave
- 2237 Dennis Ave
- 2214 Mitchell Ave
- 2314 Dennis Ave
- 2274 Purvis Ave
- 2288 Dennis Ave
- 2338 Dennis Ave
- 2314 Purvis Ave
- 2375 Mitchell Ave
Your Personal Tour Guide
Ask me questions while you tour the home.