Estimated Value: $957,000 - $1,011,482
4
Beds
4
Baths
1,948
Sq Ft
$507/Sq Ft
Est. Value
About This Home
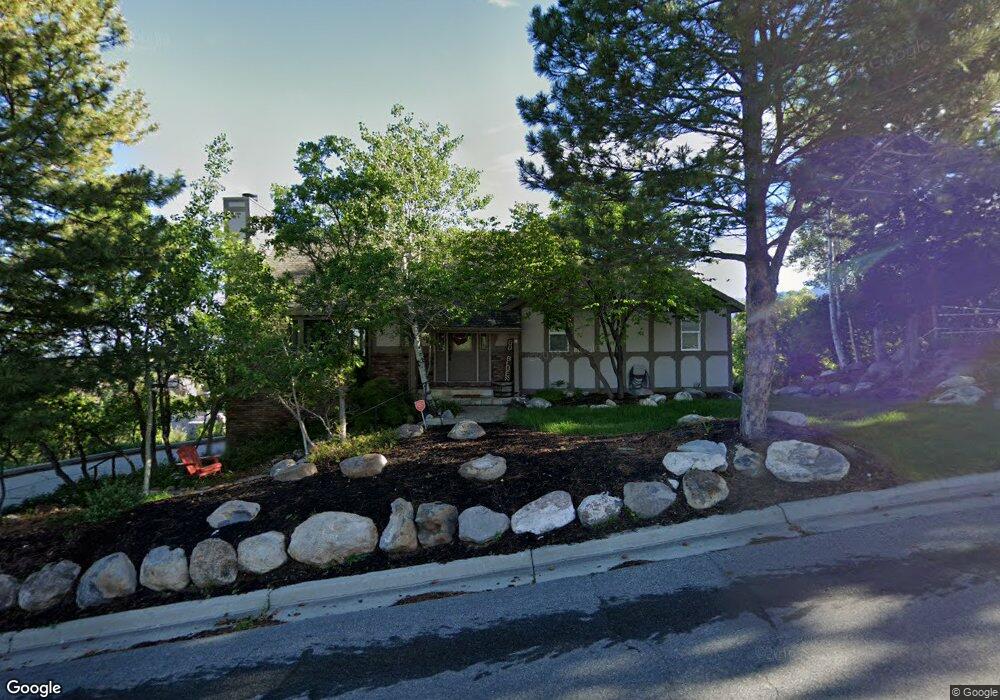
This home is located at 2289 E Willow View Way Unit 44, Sandy, UT 84092 and is currently estimated at $987,371, approximately $506 per square foot. 2289 E Willow View Way Unit 44 is a home located in Salt Lake County with nearby schools including Bell Canyon Montessori School and Challenger School - Sandy.
Ownership History
Date
Name
Owned For
Owner Type
Purchase Details
Closed on
Jun 29, 2023
Sold by
Gathard Nicholas P and Gathard Rosemary W
Bought by
Panzer Robert
Current Estimated Value
Purchase Details
Closed on
Jul 27, 2017
Sold by
Ota Melvin G and Ota Tamara Story
Bought by
Gathard Nicholas P and Gathard Rosemary W
Home Financials for this Owner
Home Financials are based on the most recent Mortgage that was taken out on this home.
Original Mortgage
$424,100
Interest Rate
3.91%
Mortgage Type
New Conventional
Purchase Details
Closed on
Jul 31, 1998
Sold by
Gorin Elizabeth L
Bought by
Ota Melvin G and Ota Tamara Story
Create a Home Valuation Report for This Property
The Home Valuation Report is an in-depth analysis detailing your home's value as well as a comparison with similar homes in the area
Home Values in the Area
Average Home Value in this Area
Purchase History
| Date | Buyer | Sale Price | Title Company |
|---|---|---|---|
| Panzer Robert | -- | None Listed On Document | |
| Panzer Robert | -- | None Listed On Document | |
| Gathard Nicholas P | -- | Us Title | |
| Gathard Nicholas P | -- | Us Title | |
| Ota Melvin G | -- | Paramount Title Corp | |
| Gorin Elizabeth L | -- | Paramount Title Corp | |
| Ota Melvin G | -- | Paramount Title Corp | |
| Gorin Elizabeth L | -- | Paramount Title Corp |
Source: Public Records
Mortgage History
| Date | Status | Borrower | Loan Amount |
|---|---|---|---|
| Previous Owner | Gathard Nicholas P | $424,100 |
Source: Public Records
Tax History
| Year | Tax Paid | Tax Assessment Tax Assessment Total Assessment is a certain percentage of the fair market value that is determined by local assessors to be the total taxable value of land and additions on the property. | Land | Improvement |
|---|---|---|---|---|
| 2025 | $5,040 | $1,002,900 | $355,500 | $647,400 |
| 2024 | $5,040 | $932,200 | $342,300 | $589,900 |
| 2023 | $4,727 | $871,600 | $329,200 | $542,400 |
| 2022 | $4,565 | $822,400 | $322,700 | $499,700 |
| 2021 | $4,135 | $634,100 | $243,800 | $390,300 |
| 2020 | $3,966 | $573,500 | $243,800 | $329,700 |
| 2019 | $3,868 | $545,000 | $230,000 | $315,000 |
| 2016 | $2,762 | $374,200 | $172,900 | $201,300 |
Source: Public Records
Map
Nearby Homes
- 2234 E Willow Brook Way
- 2250 High Mountain Dr
- 11446 S 2320 E
- 2192 E High Mesa Dr
- 2232 E Lone Eagle Ln
- 11129 S 2125 E
- 7 Rollingwood Ln
- 35 E Lone Hollow Dr
- 1 Quietwood Ln
- 18 Snow Forest Ln
- 16 Gatehouse Ln
- 5 Quietwood Ln
- 1 Cross Hill Ln
- 3 Snow Forest Cove Unit 1039
- 11551 S Woodhampton Dr
- 11318 Canyon Falls Ln
- 2342 Charros Rd
- 9 Windsong
- 2026 E 10765 S
- 1 Pepperwood Pointe
- 2289 E Willow View Way
- 2289 Willow View Way
- 2305 Willow View Way
- 2305 E Willow View Way
- 2265 E Willow View Way
- 2265 Willow View Way
- 2311 Willow View Way Unit 44
- 2280 Willow Brook Way
- 2280 E Willow Brook Way
- 2296 Willow Brook Way
- 2296 E Willow Brook Way
- 2296 E Willow Brook Way Unit 56
- 2286 E Willow View Way
- 2262 Willow Brook Way
- 2262 E Willow Brook Way
- 11378 S Willow Hill Dr
- 11378 Willow Hill Dr
- 2286 Willow View Way
- 11378 S 2275 E
- 11378 S Willow Hill Dr
Your Personal Tour Guide
Ask me questions while you tour the home.