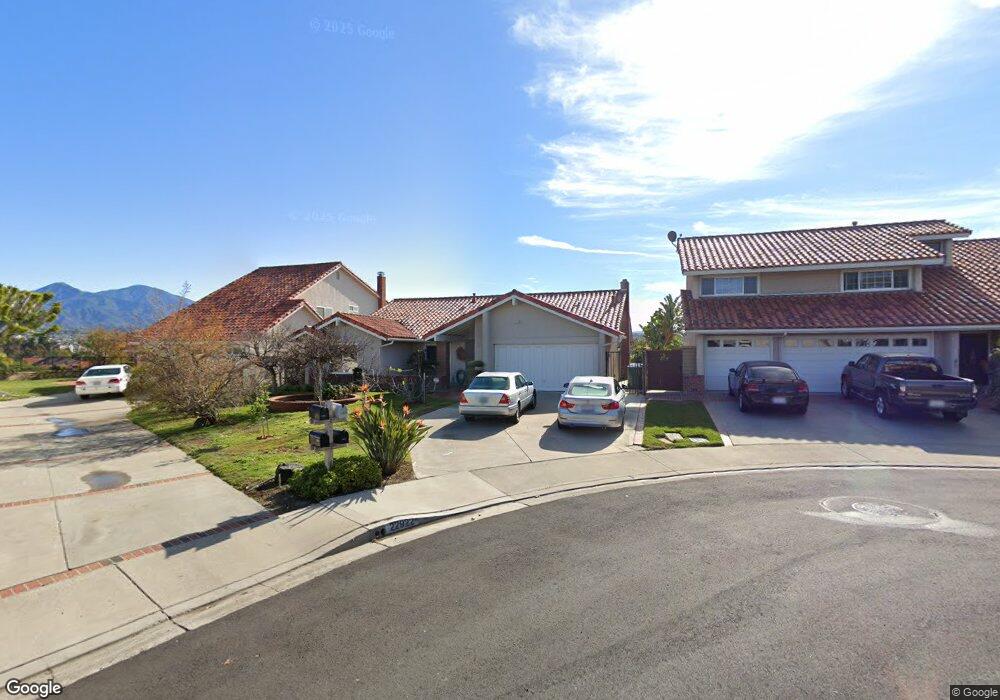
22922 Arija Mission Viejo, CA 92691
Estimated Value: $1,262,631 - $1,482,000
4
Beds
2
Baths
1,916
Sq Ft
$723/Sq Ft
Est. Value
About This Home
This home is located at 22922 Arija, Mission Viejo, CA 92691 and is currently estimated at $1,385,908, approximately $723 per square foot. 22922 Arija is a home located in Orange County with nearby schools including Castille Elementary School, Newhart Middle School, and Capistrano Valley High School.
Ownership History
Date
Name
Owned For
Owner Type
Purchase Details
Closed on
Sep 15, 2017
Sold by
Talebi Mahmood and Talebi Mary H
Bought by
Talebi Mahmood and Talebi Mary H
Current Estimated Value
Purchase Details
Closed on
May 8, 2002
Sold by
Talebi Mary Helali
Bought by
Talebi Mahmood and Talebi Mary H
Purchase Details
Closed on
Mar 11, 1998
Sold by
Talebi Mahmood
Bought by
Talebi Mary Helali
Home Financials for this Owner
Home Financials are based on the most recent Mortgage that was taken out on this home.
Original Mortgage
$72,000
Interest Rate
6.97%
Purchase Details
Closed on
Feb 11, 1998
Sold by
Helali Talebi Mehrangiz and Helali Mary Helali
Bought by
Talebi Mahmood and Talebi Mary Helali
Home Financials for this Owner
Home Financials are based on the most recent Mortgage that was taken out on this home.
Original Mortgage
$72,000
Interest Rate
6.97%
Purchase Details
Closed on
Feb 25, 1993
Sold by
Talebi Mahmood
Bought by
Talebi Mehrangiz Helali
Create a Home Valuation Report for This Property
The Home Valuation Report is an in-depth analysis detailing your home's value as well as a comparison with similar homes in the area
Home Values in the Area
Average Home Value in this Area
Purchase History
| Date | Buyer | Sale Price | Title Company |
|---|---|---|---|
| Talebi Mahmood | -- | None Available | |
| Talebi Mahmood | -- | -- | |
| Talebi Mary Helali | -- | -- | |
| Talebi Mahmood | -- | Landsafe Title | |
| Talebi Mehrangiz Helali | -- | -- |
Source: Public Records
Mortgage History
| Date | Status | Borrower | Loan Amount |
|---|---|---|---|
| Closed | Talebi Mahmood | $72,000 |
Source: Public Records
Tax History Compared to Growth
Tax History
| Year | Tax Paid | Tax Assessment Tax Assessment Total Assessment is a certain percentage of the fair market value that is determined by local assessors to be the total taxable value of land and additions on the property. | Land | Improvement |
|---|---|---|---|---|
| 2025 | $4,790 | $488,088 | $317,368 | $170,720 |
| 2024 | $4,790 | $478,518 | $311,145 | $167,373 |
| 2023 | $4,687 | $469,136 | $305,044 | $164,092 |
| 2022 | $4,597 | $459,938 | $299,063 | $160,875 |
| 2021 | $4,507 | $450,920 | $293,199 | $157,721 |
| 2020 | $4,461 | $446,297 | $290,193 | $156,104 |
| 2019 | $4,372 | $437,547 | $284,503 | $153,044 |
| 2018 | $4,287 | $428,968 | $278,924 | $150,044 |
| 2017 | $4,202 | $420,557 | $273,455 | $147,102 |
| 2016 | $4,120 | $412,311 | $268,093 | $144,218 |
| 2015 | $4,074 | $406,118 | $264,066 | $142,052 |
| 2014 | $3,994 | $398,163 | $258,893 | $139,270 |
Source: Public Records
Map
Nearby Homes
- 23032 Sonoita
- 22982 Cecelia
- 22792 Orellana
- 23251 Via Guadix
- 23224 Coso Unit 51
- 23266 Via Ronda
- 22642 Via Santiago
- 23382 Via Chiripa
- 23332 Coso Unit 134
- 27782 Soller Unit 39
- 23247 Cherry Hills St
- 27805 Barbate Unit 15
- 27879 Chipiona Unit 52
- 27882 Finisterra Unit 117
- 27913 Trocadero Unit 68
- 22415 Salmeron
- 23431 Via Guadix
- 22735 Via Santa Rosa
- 27887 Mazagon
- 23336 Via Bahia