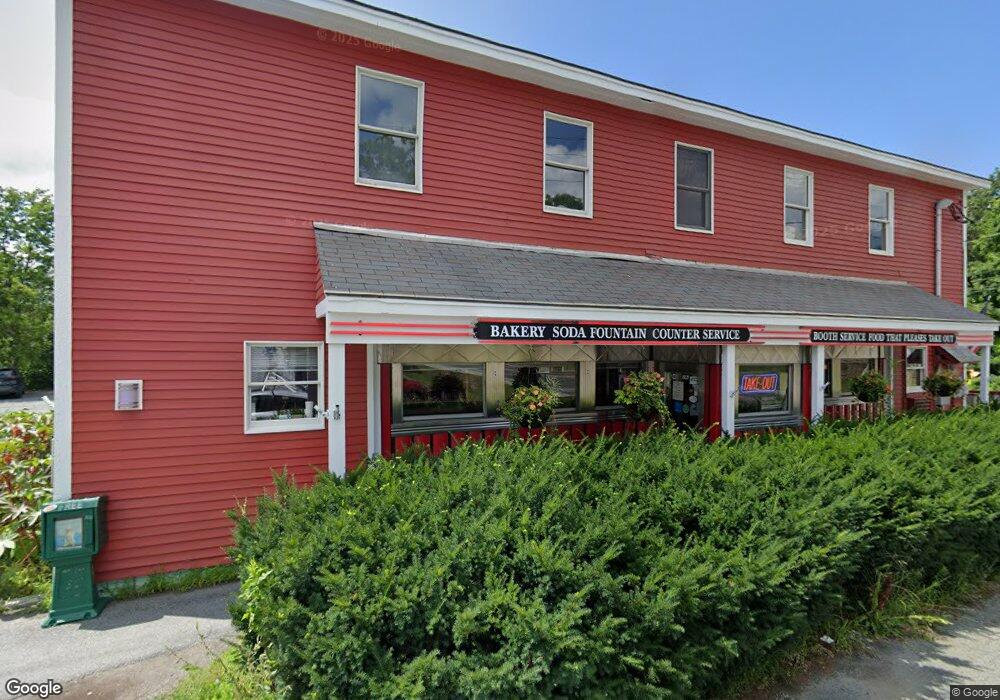
23 Bridge St West Lebanon, NH 03784
Estimated Value: $765,288
--
Bed
2
Baths
3,808
Sq Ft
$201/Sq Ft
Est. Value
About This Home
This home is located at 23 Bridge St, West Lebanon, NH 03784 and is currently estimated at $765,288, approximately $200 per square foot. 23 Bridge St is a home located in Grafton County with nearby schools including Mt. Lebanon School, Lebanon Middle School, and Lebanon High School.
Ownership History
Date
Name
Owned For
Owner Type
Purchase Details
Closed on
Apr 30, 2025
Sold by
Jones Karen E and Briggs Leann
Bought by
Allard Properties Llc
Current Estimated Value
Home Financials for this Owner
Home Financials are based on the most recent Mortgage that was taken out on this home.
Original Mortgage
$487,500
Outstanding Balance
$484,906
Interest Rate
6.67%
Mortgage Type
Commercial
Estimated Equity
$280,382
Purchase Details
Closed on
May 22, 2018
Sold by
Shorey Steven F and Briggs Leann F
Bought by
Shorey Frances B
Purchase Details
Closed on
Jun 2, 2016
Sold by
Shorey Frances B
Bought by
Frank R & F B Shorey Ret
Create a Home Valuation Report for This Property
The Home Valuation Report is an in-depth analysis detailing your home's value as well as a comparison with similar homes in the area
Home Values in the Area
Average Home Value in this Area
Purchase History
| Date | Buyer | Sale Price | Title Company |
|---|---|---|---|
| Allard Properties Llc | $750,000 | None Available | |
| Allard Properties Llc | $750,000 | None Available | |
| Shorey Frances B | -- | -- | |
| Shorey Frances B | -- | -- | |
| Frank R & F B Shorey Ret | -- | -- | |
| Frank R & F B Shorey Ret | -- | -- |
Source: Public Records
Mortgage History
| Date | Status | Borrower | Loan Amount |
|---|---|---|---|
| Open | Allard Properties Llc | $487,500 | |
| Closed | Allard Properties Llc | $487,500 | |
| Previous Owner | Frank R & F B Shorey Ret | $217,222 | |
| Previous Owner | Frank R & F B Shorey Ret | $200,000 |
Source: Public Records
Tax History Compared to Growth
Tax History
| Year | Tax Paid | Tax Assessment Tax Assessment Total Assessment is a certain percentage of the fair market value that is determined by local assessors to be the total taxable value of land and additions on the property. | Land | Improvement |
|---|---|---|---|---|
| 2024 | $17,347 | $660,100 | $273,400 | $386,700 |
| 2023 | $16,027 | $660,100 | $273,400 | $386,700 |
| 2022 | $15,206 | $660,000 | $273,300 | $386,700 |
| 2021 | $16,134 | $598,000 | $212,600 | $385,400 |
| 2019 | $15,580 | $513,000 | $186,000 | $327,000 |
| 2018 | $2,227 | $513,000 | $186,000 | $327,000 |
| 2017 | $2,463 | $513,000 | $186,000 | $327,000 |
| 2016 | $2,472 | $513,900 | $186,000 | $327,900 |
| 2015 | $14,189 | $513,900 | $186,000 | $327,900 |
| 2014 | $14,307 | $544,600 | $204,600 | $340,000 |
| 2013 | $13,872 | $543,800 | $204,600 | $339,200 |
Source: Public Records
Map
Nearby Homes
- 36-48 S Main St
- 35 Railroad Row Unit C3-2
- 3 Maple St
- 40 Union St
- 184 Hazen St
- 13 Pasture Ln
- 48 Fairview Terrace
- 260 Highland Ave
- 13 Bullard St Unit 15
- 113 Hanover St
- 25 Marshall Ave
- 722 Fairview Terrace
- 27 Ash St
- 1015 Maple St
- 15 Old Pine Tree Cemetery Rd
- 1049 N Main St
- 94 Dogwood Cir
- 11 Rock Ridge Blvd
- 46 Ledgeside Terrace
- 4 Black Bear Ct
- 1 Commercial Dr
- 3 Crafts Ave
- 6 Crafts Ave
- 15 Crafts Ave
- 16 Crafts Ave
- 17 Crafts Ave Unit 19
- 75 Main St
- 115 N Main St
- 111 N Main St Unit B
- 111 N Main St
- 21 Crafts Ave
- 117 N Main St Unit 7
- 110 N Main St
- 18 Crafts Ave
- 23 Crafts Ave
- 20 Crafts Ave
- 133 N Main St
- 5 Prospect St W
- 27 Crafts Ave
- 7 Prospect St W