C
Seller's Agent in 2016
Cass Costa
Berkshire Hathaway HomeServices Robert Paul Properties

Estimated Value: $1,970,000 - $2,615,000
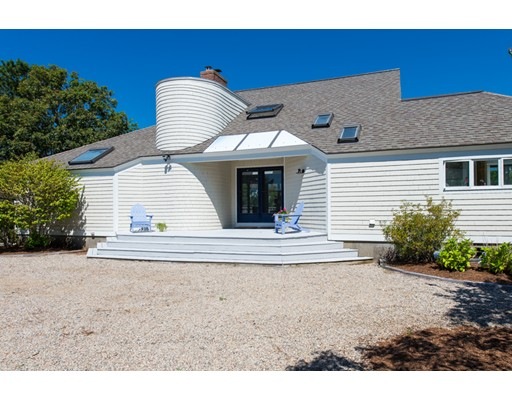
new seabury waterfront with deep water dock
Last Agent to Sell the Property
Cass Costa
Berkshire Hathaway HomeServices Robert Paul Properties Listed on: 04/03/2016

Last Buyer's Agent
Cass Costa
Berkshire Hathaway HomeServices Robert Paul Properties Listed on: 04/03/2016
| Date | Buyer | Sale Price | Title Company |
|---|---|---|---|
| Susand M Brady 1999 T M | -- | None Available | |
| Brady Susan M | -- | None Available | |
| Brady Paul J | $1,080,000 | -- | |
| Thomas M Piersiak & Sons | $1,000,000 | -- | |
| Thomas M Piersiak & Sons | $1,000,000 | -- |
| Date | Status | Borrower | Loan Amount |
|---|---|---|---|
| Closed | Thomas M Piersiak & Sons | $0 |
| Date | Event | Price | List to Sale | Price per Sq Ft | Prior Sale |
|---|---|---|---|---|---|
| 04/05/2016 04/05/16 | Sold | $1,070,000 | -8.9% | $494 / Sq Ft | |
| 04/04/2016 04/04/16 | Pending | -- | -- | -- | |
| 04/03/2016 04/03/16 | For Sale | $1,175,000 | +8.8% | $543 / Sq Ft | |
| 03/31/2016 03/31/16 | Sold | $1,080,000 | -9.6% | $499 / Sq Ft | View Prior Sale |
| 03/10/2016 03/10/16 | Pending | -- | -- | -- | |
| 07/27/2015 07/27/15 | For Sale | $1,195,000 | +19.5% | $552 / Sq Ft | |
| 06/30/2014 06/30/14 | Sold | $1,000,000 | -13.0% | $462 / Sq Ft | View Prior Sale |
| 04/09/2014 04/09/14 | Pending | -- | -- | -- | |
| 09/17/2013 09/17/13 | For Sale | $1,150,000 | -- | $531 / Sq Ft |
| Year | Tax Paid | Tax Assessment Tax Assessment Total Assessment is a certain percentage of the fair market value that is determined by local assessors to be the total taxable value of land and additions on the property. | Land | Improvement |
|---|---|---|---|---|
| 2025 | $15,241 | $2,302,200 | $1,432,600 | $869,600 |
| 2024 | $13,709 | $2,132,100 | $1,302,600 | $829,500 |
| 2023 | $13,421 | $1,914,600 | $1,240,300 | $674,300 |
| 2022 | $13,359 | $1,635,100 | $1,074,700 | $560,400 |
| 2021 | $14,107 | $1,555,400 | $1,063,700 | $491,700 |
| 2020 | $13,356 | $1,469,300 | $1,023,000 | $446,300 |
| 2019 | $12,712 | $1,404,600 | $1,023,000 | $381,600 |
| 2018 | $12,317 | $1,380,800 | $1,023,000 | $357,800 |
| 2017 | $12,015 | $1,307,400 | $1,023,000 | $284,400 |
| 2016 | $11,931 | $1,291,200 | $1,023,000 | $268,200 |
| 2015 | $11,633 | $1,276,900 | $1,023,000 | $253,900 |
| 2014 | $11,888 | $1,266,000 | $1,009,100 | $256,900 |
C
Seller's Agent in 2016
Cass Costa
Berkshire Hathaway HomeServices Robert Paul Properties
T
Seller's Agent in 2016
Team Cass Costa-Marlene Susienka
Robert Paul Properties, Inc.
Buyer's Agent in 2016
Mark Thompson
New Seabury Sotheby's International Realty
(508) 345-1525
45 in this area
58 Total Sales
A
Seller's Agent in 2014
Anthony Lamacchia
McGeough Lamacchia Realty, Inc
T
Buyer's Agent in 2014
Team New Seabury Specialists
New Seabury Sotheby's International Realty
Source: MLS Property Information Network (MLS PIN)
MLS Number: 71982108
APN: MASH-000112-000025
Disclaimer: Certain information contained herein is derived from information provided by parties other than Homes.com. All information provided is deemed reliable, but is not guaranteed to be accurate and should be independently verified.
![]() The property listing data and information, or the Images, set forth herein were provided to MLS Property Information Network, Inc. from third party sources, including sellers, lessors and public records, and were compiled by MLS Property Information Network, Inc. The property listing data and information, and the Images, are for the personal, non-commercial use of consumers having a good faith interest in purchasing or leasing listed properties of the type displayed to them and may not be used for any purpose other than to identify prospective properties which such consumers may have a good faith interest in purchasing or leasing. MLS Property Information Network, Inc. and its subscribers disclaim any and all representations and warranties as to the accuracy of the property listing data and information, or as to the accuracy of any of the Images, set forth herein.
The property listing data and information, or the Images, set forth herein were provided to MLS Property Information Network, Inc. from third party sources, including sellers, lessors and public records, and were compiled by MLS Property Information Network, Inc. The property listing data and information, and the Images, are for the personal, non-commercial use of consumers having a good faith interest in purchasing or leasing listed properties of the type displayed to them and may not be used for any purpose other than to identify prospective properties which such consumers may have a good faith interest in purchasing or leasing. MLS Property Information Network, Inc. and its subscribers disclaim any and all representations and warranties as to the accuracy of the property listing data and information, or as to the accuracy of any of the Images, set forth herein.
Ask me questions while you tour the home.