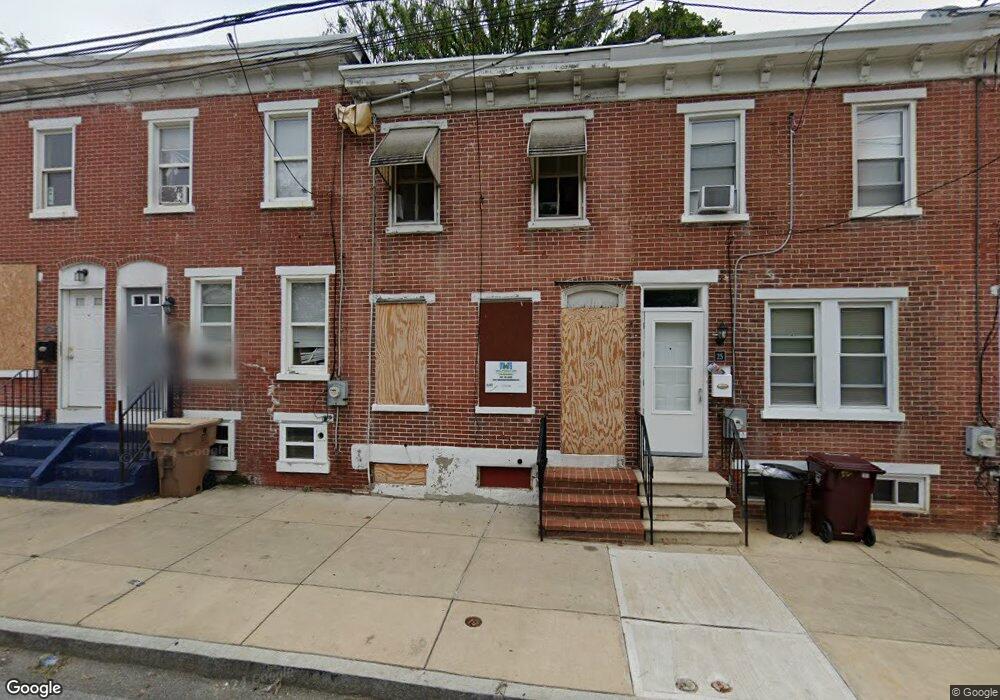
23 E 22nd St Wilmington, DE 19802
Brandywine Village NeighborhoodEstimated Value: $116,779 - $167,000
2
Beds
1
Bath
942
Sq Ft
$150/Sq Ft
Est. Value
About This Home
This home is located at 23 E 22nd St, Wilmington, DE 19802 and is currently estimated at $141,695, approximately $150 per square foot. 23 E 22nd St is a home with nearby schools including Lombardy Elementary School, Springer Middle School, and Brandywine High School.
Ownership History
Date
Name
Owned For
Owner Type
Purchase Details
Closed on
Apr 1, 2021
Sold by
Wilmington Neighborhood Conservancy Land
Bought by
Jenkins George
Current Estimated Value
Purchase Details
Closed on
Sep 28, 2018
Sold by
City Of Wilmington
Bought by
Wilmington Neighborhood Conservancy Land
Purchase Details
Closed on
Mar 9, 2018
Sold by
Tatum Juanita L and Tatman Roberta I
Bought by
City Of Wilmington
Purchase Details
Closed on
Oct 4, 2005
Sold by
Tatman Juanita Louise
Bought by
Tatman Juanita Louise and Tatman Roberta L
Create a Home Valuation Report for This Property
The Home Valuation Report is an in-depth analysis detailing your home's value as well as a comparison with similar homes in the area
Home Values in the Area
Average Home Value in this Area
Purchase History
| Date | Buyer | Sale Price | Title Company |
|---|---|---|---|
| Jenkins George | -- | None Available | |
| Wilmington Neighborhood Conservancy Land | -- | None Available | |
| City Of Wilmington | $18,640 | None Available | |
| Tatman Juanita Louise | -- | -- |
Source: Public Records
Tax History
| Year | Tax Paid | Tax Assessment Tax Assessment Total Assessment is a certain percentage of the fair market value that is determined by local assessors to be the total taxable value of land and additions on the property. | Land | Improvement |
|---|---|---|---|---|
| 2024 | $549 | $17,000 | $2,000 | $15,000 |
| 2023 | $498 | $17,000 | $2,000 | $15,000 |
| 2022 | $504 | $17,000 | $2,000 | $15,000 |
| 2021 | $339 | $17,000 | $2,000 | $15,000 |
| 2020 | $339 | $17,000 | $2,000 | $15,000 |
| 2019 | $339 | $17,000 | $2,000 | $15,000 |
| 2018 | $1,442 | $17,000 | $2,000 | $15,000 |
| 2017 | $557 | $17,000 | $2,000 | $15,000 |
| 2016 | $557 | $17,000 | $2,000 | $15,000 |
| 2015 | $535 | $17,000 | $2,000 | $15,000 |
| 2014 | $535 | $17,000 | $2,000 | $15,000 |
Source: Public Records
Map
Nearby Homes
- 2300 N Market St
- 31 E 23rd St
- 2314 N Market St
- 2318 N Market St
- 217 E 22nd St
- 2313 Carter St
- 2305 Jessup St
- 2401 Carter St
- 308 E 23rd St
- 2203 N Pine St
- 101 W 23rd St
- 2321 N Tatnall St
- 19 E 25th St
- 2009 N Tatnall St
- 209 E 25th St
- 122 W 23rd St
- 24 W 20th St
- 606 E 22nd St
- 2616 N Market St
- 2011 N West St
Your Personal Tour Guide
Ask me questions while you tour the home.