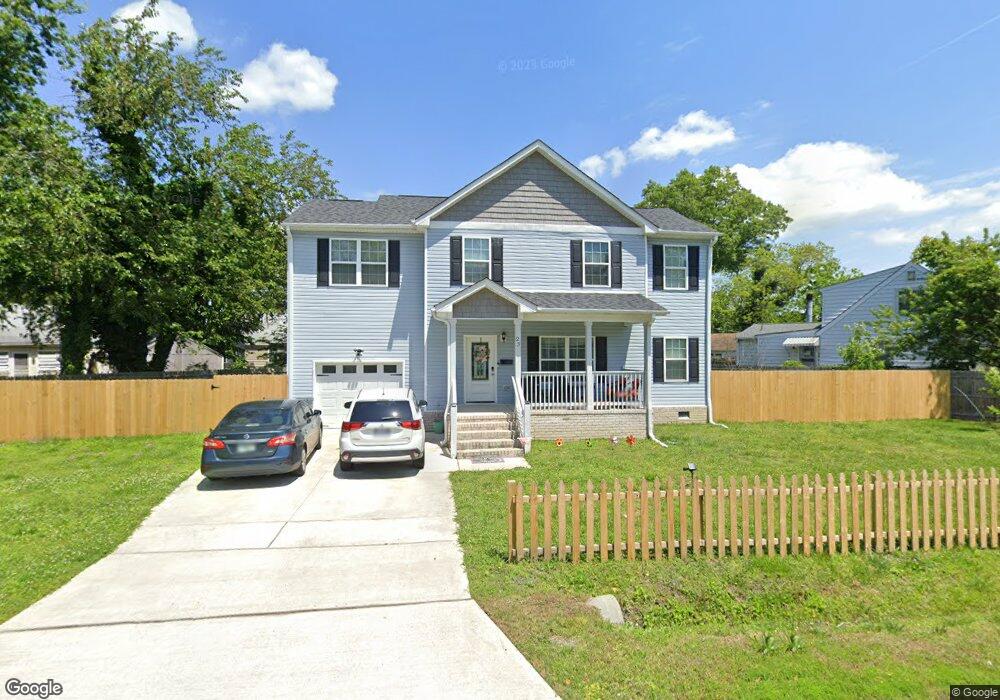
23 W Southampton Ave Hampton, VA 23669
Newtown-Crown Point NeighborhoodEstimated Value: $375,988 - $431,000
4
Beds
3
Baths
2,460
Sq Ft
$163/Sq Ft
Est. Value
About This Home
This home is located at 23 W Southampton Ave, Hampton, VA 23669 and is currently estimated at $400,747, approximately $162 per square foot. 23 W Southampton Ave is a home located in Hampton City with nearby schools including Hunter B. Andrews PK-8 School, C. Alton Lindsay Middle School, and Phoebus High School.
Ownership History
Date
Name
Owned For
Owner Type
Purchase Details
Closed on
Dec 18, 2018
Sold by
Tiger Johnson Llc
Bought by
Edward Canisus B and Edward Yonette C
Current Estimated Value
Home Financials for this Owner
Home Financials are based on the most recent Mortgage that was taken out on this home.
Original Mortgage
$260,380
Outstanding Balance
$229,858
Interest Rate
4.9%
Mortgage Type
VA
Estimated Equity
$170,889
Purchase Details
Closed on
Dec 14, 2017
Sold by
Future Development Inc A Virginia Corpor
Bought by
Tiger Johnson Llc A Virginia Limited Lia
Purchase Details
Closed on
Oct 12, 2016
Sold by
Reynolds James R and Reynolds Connie S
Bought by
Future Development Inc A Virginia Corpor
Purchase Details
Closed on
Oct 17, 2006
Sold by
Reynolds James R
Bought by
Reynolds James R
Create a Home Valuation Report for This Property
The Home Valuation Report is an in-depth analysis detailing your home's value as well as a comparison with similar homes in the area
Home Values in the Area
Average Home Value in this Area
Purchase History
| Date | Buyer | Sale Price | Title Company |
|---|---|---|---|
| Edward Canisus B | $254,900 | Omni Title And Escrow Llc | |
| Tiger Johnson Llc A Virginia Limited Lia | $38,000 | True North Title | |
| Future Development Inc A Virginia Corpor | $23,500 | Attorney | |
| Reynolds James R | $10,000 | -- |
Source: Public Records
Mortgage History
| Date | Status | Borrower | Loan Amount |
|---|---|---|---|
| Open | Edward Canisus B | $260,380 |
Source: Public Records
Tax History Compared to Growth
Tax History
| Year | Tax Paid | Tax Assessment Tax Assessment Total Assessment is a certain percentage of the fair market value that is determined by local assessors to be the total taxable value of land and additions on the property. | Land | Improvement |
|---|---|---|---|---|
| 2025 | $4,076 | $393,900 | $53,500 | $340,400 |
| 2024 | $4,076 | $354,400 | $53,500 | $300,900 |
| 2023 | $4,015 | $346,100 | $53,500 | $292,600 |
| 2022 | $3,757 | $318,400 | $48,200 | $270,200 |
| 2021 | $3,635 | $282,700 | $48,200 | $234,500 |
| 2020 | $3,379 | $272,500 | $38,700 | $233,800 |
| 2019 | $3,153 | $254,300 | $38,700 | $215,600 |
| 2018 | $458 | $38,700 | $38,700 | $0 |
| 2017 | $1,184 | $0 | $0 | $0 |
| 2016 | $574 | $38,700 | $0 | $0 |
| 2015 | $543 | $0 | $0 | $0 |
| 2014 | $533 | $36,200 | $36,200 | $0 |
Source: Public Records
Map
Nearby Homes
- 15 Henry St
- 4204 Kecoughtan Rd
- 32 W Sunset Rd
- 29 Moss Ave
- 116 Ivy Home Rd
- 15 Victor St
- 3822 Victoria Blvd
- 17 Somerset Ln
- 17 Palmerston Dr
- 12 Fleetwood Ave
- 3609 Victoria Blvd
- 243 Newport News Ave
- 241 Newport News Ave
- 408 Newport News Ave
- 430 Newport News Ave
- 4006 Monitor Dr
- 326 Brightwood Ave
- 3611 Matoaka Rd
- 429 Lee St
- 4017 Buchanan Dr
- 13 Earl St
- 18 Henry St
- 16 Henry St
- 11 Earl St
- 14 Henry St
- 22 Henry St
- 24 W Southampton Ave
- 26 W Southampton Ave
- 22 W Southampton Ave
- 12 Henry St
- 9 Earl St
- 28 W Southampton Ave
- 20 W Southampton Ave
- 10 Henry St
- 18 W Southampton Ave
- 7 Earl St
- 32 W Southampton Ave
- 8 Henry St
- 16 W Southampton Ave
- 6 Earl St