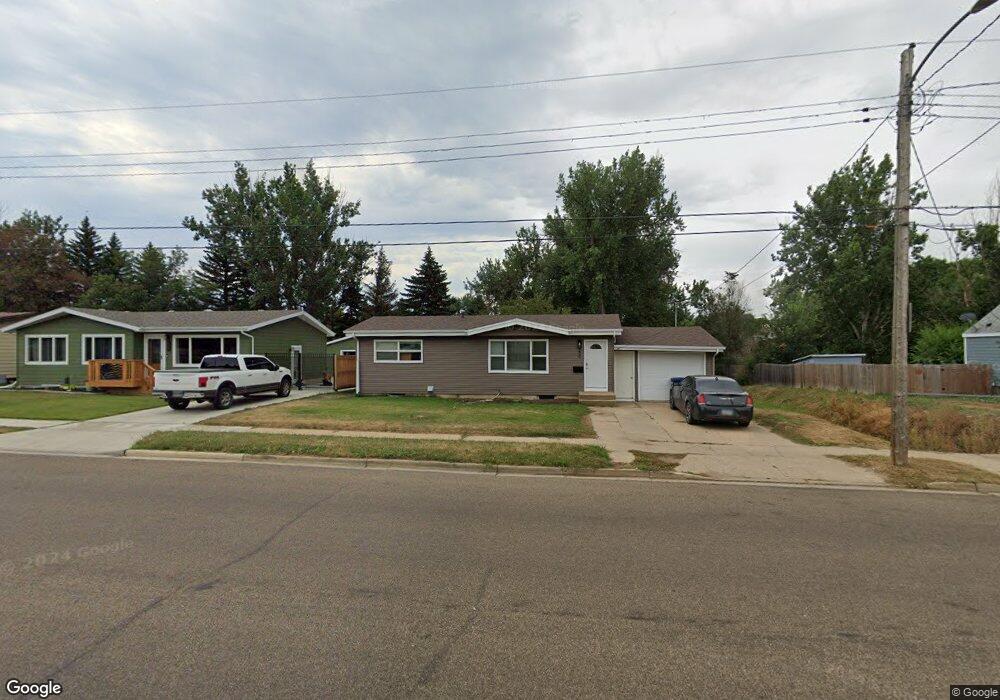
230 9th St E Dickinson, ND 58601
Estimated Value: $229,000 - $312,000
4
Beds
2
Baths
912
Sq Ft
$282/Sq Ft
Est. Value
About This Home
This home is located at 230 9th St E, Dickinson, ND 58601 and is currently estimated at $257,239, approximately $282 per square foot. 230 9th St E is a home located in Stark County with nearby schools including Trinity Elementary School East.
Ownership History
Date
Name
Owned For
Owner Type
Purchase Details
Closed on
Jan 24, 2017
Sold by
Roberts Winton and Roberts Nicole M
Bought by
Roberts Winton and Roberts Nicole M
Current Estimated Value
Purchase Details
Closed on
Apr 4, 2011
Sold by
Lamprecht Clara and Lamprecht Clara M
Bought by
Ewoniuk Nicole M
Home Financials for this Owner
Home Financials are based on the most recent Mortgage that was taken out on this home.
Original Mortgage
$119,165
Outstanding Balance
$81,650
Interest Rate
5.04%
Mortgage Type
New Conventional
Estimated Equity
$175,589
Create a Home Valuation Report for This Property
The Home Valuation Report is an in-depth analysis detailing your home's value as well as a comparison with similar homes in the area
Home Values in the Area
Average Home Value in this Area
Purchase History
| Date | Buyer | Sale Price | Title Company |
|---|---|---|---|
| Roberts Winton | -- | None Available | |
| Ewoniuk Nicole M | -- | None Available |
Source: Public Records
Mortgage History
| Date | Status | Borrower | Loan Amount |
|---|---|---|---|
| Open | Ewoniuk Nicole M | $119,165 |
Source: Public Records
Tax History
| Year | Tax Paid | Tax Assessment Tax Assessment Total Assessment is a certain percentage of the fair market value that is determined by local assessors to be the total taxable value of land and additions on the property. | Land | Improvement |
|---|---|---|---|---|
| 2025 | $741 | $191,000 | $21,600 | $169,400 |
| 2024 | $1,802 | $191,000 | $21,600 | $169,400 |
| 2023 | $1,884 | $191,000 | $21,600 | $169,400 |
| 2022 | $1,784 | $89,650 | $0 | $0 |
| 2021 | $1,740 | $169,200 | $21,600 | $147,600 |
| 2020 | $1,764 | $169,200 | $21,600 | $147,600 |
| 2019 | $1,769 | $169,200 | $21,600 | $147,600 |
| 2017 | $1,494 | $152,000 | $21,600 | $130,400 |
| 2015 | $1,494 | $170,700 | $20,500 | $150,200 |
| 2014 | $1,591 | $168,200 | $20,500 | $147,700 |
| 2013 | -- | $162,300 | $20,500 | $141,800 |
Source: Public Records
Map
Nearby Homes
Your Personal Tour Guide
Ask me questions while you tour the home.