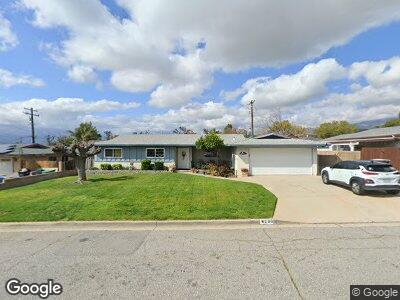
230 Syllmar Cir Calimesa, CA 92320
Estimated Value: $485,438 - $501,000
3
Beds
2
Baths
1,402
Sq Ft
$353/Sq Ft
Est. Value
About This Home
This home is located at 230 Syllmar Cir, Calimesa, CA 92320 and is currently estimated at $494,610, approximately $352 per square foot. 230 Syllmar Cir is a home located in Riverside County with nearby schools including Wildwood Elementary School, Mesa View Middle School, and Yucaipa High School.
Ownership History
Date
Name
Owned For
Owner Type
Purchase Details
Closed on
Dec 5, 2010
Sold by
Maness Melinda Murray
Bought by
Murray Adams Melinda Fay and Adams Family Trust
Current Estimated Value
Purchase Details
Closed on
Nov 14, 2002
Sold by
Murray Cecil M and Murray Beverly
Bought by
Maness Melinda Murray
Purchase Details
Closed on
Jan 21, 1997
Sold by
Rees Robert D and Rees Patricia
Bought by
Aguilar Edgar and Aguilar Maria
Home Financials for this Owner
Home Financials are based on the most recent Mortgage that was taken out on this home.
Original Mortgage
$25,000
Interest Rate
5.85%
Mortgage Type
Seller Take Back
Purchase Details
Closed on
Dec 12, 1996
Sold by
Bradley Patricia P
Bought by
Rees Robert D and Rees Patricia
Home Financials for this Owner
Home Financials are based on the most recent Mortgage that was taken out on this home.
Original Mortgage
$25,000
Interest Rate
5.85%
Mortgage Type
Seller Take Back
Create a Home Valuation Report for This Property
The Home Valuation Report is an in-depth analysis detailing your home's value as well as a comparison with similar homes in the area
Home Values in the Area
Average Home Value in this Area
Purchase History
| Date | Buyer | Sale Price | Title Company |
|---|---|---|---|
| Murray Adams Melinda Fay | -- | None Available | |
| Maness Melinda Murray | -- | Diversified Title & Escrow S | |
| Aguilar Edgar | $23,500 | Diversified Title & Escrow S | |
| Rees Robert D | $23,043 | Diversified Title & Escrow S |
Source: Public Records
Mortgage History
| Date | Status | Borrower | Loan Amount |
|---|---|---|---|
| Open | Murray Maness Melinda | $20,000 | |
| Previous Owner | Aguilar Edgar | $25,000 |
Source: Public Records
Tax History Compared to Growth
Tax History
| Year | Tax Paid | Tax Assessment Tax Assessment Total Assessment is a certain percentage of the fair market value that is determined by local assessors to be the total taxable value of land and additions on the property. | Land | Improvement |
|---|---|---|---|---|
| 2023 | $2,479 | $205,380 | $67,962 | $137,418 |
| 2022 | $2,396 | $201,354 | $66,630 | $134,724 |
| 2021 | $2,364 | $197,407 | $65,324 | $132,083 |
| 2020 | $2,361 | $195,384 | $64,655 | $130,729 |
| 2019 | $2,259 | $191,554 | $63,388 | $128,166 |
| 2018 | $2,237 | $187,799 | $62,146 | $125,653 |
| 2017 | $2,186 | $184,118 | $60,928 | $123,190 |
| 2016 | $2,142 | $180,509 | $59,734 | $120,775 |
| 2015 | $2,118 | $177,800 | $58,838 | $118,962 |
| 2014 | $2,074 | $174,320 | $57,687 | $116,633 |
Source: Public Records
Map
Nearby Homes
- 217 Syllmar Cir
- 916 Stearns St
- 222 Garden Air Ct
- 342 E Avenue L
- 13664 Bryant St
- 950 California St Unit 87
- 950 California St Unit 119
- 35339 San Pablo Dr
- 35230 San Carlos St
- 375 E County Line Rd
- 1229 Pinehurst Dr
- 35616 Oak Creek Dr
- 173 Victoria Ln
- 35280 Santa Maria St
- 37 Laurel Ct
- 1334 Pinehurst Dr
- 34878 County Line Rd
- 477 E County Line Rd
- 35854 Rebecca Rd
- 13487 Fremont St
- 230 Syllmar Cir
- 224 Syllmar Cir
- 236 Syllmar Cir
- 229 Loretta Way
- 223 Loretta Way
- 249 Syllmar Cir
- 218 Syllmar Cir
- 229 Syllmar Cir
- 223 Syllmar Cir
- 235 Syllmar Cir
- 217 Loretta Way
- 212 Syllmar Cir
- 251 Syllmar Cir
- 0 Loretta Way Unit P784951
- 261 Syllmar Cir
- 211 Loretta Way
- 245 Syllmar Cir
- 241 Syllmar Cir
- 232 Loretta Way
- 224 Loretta Way