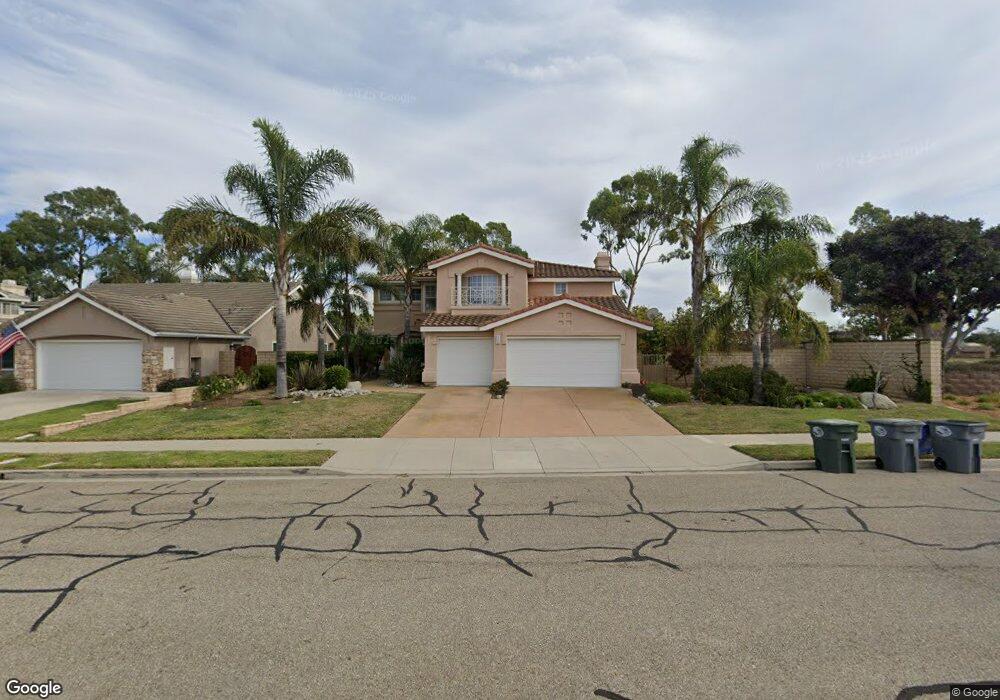
2300 Pebble Beach Trail Oxnard, CA 93036
Windsor North River Ridge NeighborhoodEstimated Value: $1,178,000 - $1,344,000
4
Beds
3
Baths
2,699
Sq Ft
$460/Sq Ft
Est. Value
About This Home
This home is located at 2300 Pebble Beach Trail, Oxnard, CA 93036 and is currently estimated at $1,241,980, approximately $460 per square foot. 2300 Pebble Beach Trail is a home located in Ventura County with nearby schools including Thurgood Marshall Elementary School and Oxnard High School.
Ownership History
Date
Name
Owned For
Owner Type
Purchase Details
Closed on
Jul 23, 2014
Sold by
Ching Joe Hsin and Ching Hu Ko
Bought by
Ching Family Trust and Ching Hu Ko
Current Estimated Value
Purchase Details
Closed on
Sep 11, 1996
Sold by
Trimark Development Company
Bought by
Ching Joe H and Ching Hu Ko
Home Financials for this Owner
Home Financials are based on the most recent Mortgage that was taken out on this home.
Original Mortgage
$207,000
Interest Rate
7.21%
Create a Home Valuation Report for This Property
The Home Valuation Report is an in-depth analysis detailing your home's value as well as a comparison with similar homes in the area
Home Values in the Area
Average Home Value in this Area
Purchase History
| Date | Buyer | Sale Price | Title Company |
|---|---|---|---|
| Ching Family Trust | -- | None Available | |
| Ching Joe H | $273,000 | Continental Lawyers Title Co |
Source: Public Records
Mortgage History
| Date | Status | Borrower | Loan Amount |
|---|---|---|---|
| Previous Owner | Ching Joe H | $207,000 |
Source: Public Records
Tax History
| Year | Tax Paid | Tax Assessment Tax Assessment Total Assessment is a certain percentage of the fair market value that is determined by local assessors to be the total taxable value of land and additions on the property. | Land | Improvement |
|---|---|---|---|---|
| 2025 | $5,335 | $444,563 | $177,822 | $266,741 |
| 2024 | $5,335 | $435,847 | $174,336 | $261,511 |
| 2023 | $5,140 | $427,301 | $170,917 | $256,384 |
| 2022 | $4,984 | $418,923 | $167,566 | $251,357 |
| 2021 | $4,943 | $410,709 | $164,280 | $246,429 |
| 2020 | $5,033 | $406,500 | $162,597 | $243,903 |
| 2019 | $4,890 | $398,530 | $159,409 | $239,121 |
| 2018 | $4,821 | $390,717 | $156,284 | $234,433 |
| 2017 | $4,575 | $383,057 | $153,220 | $229,837 |
| 2016 | $4,423 | $375,547 | $150,216 | $225,331 |
| 2015 | $4,468 | $369,908 | $147,960 | $221,948 |
| 2014 | $5,157 | $362,663 | $145,062 | $217,601 |
Source: Public Records
Map
Nearby Homes
- 2310 Crown Point Ct
- 2134 Cold Stream Ct
- 2151 Olga St
- 1510 Holly Ave
- 3325 Eagle Bend Ln
- 2056 Mission Hills Dr
- 2100 Norma St
- 1979 Newcastle Dr
- 1721 Joanne Way
- 1300 Bluebell St
- 1420 Joliet Place
- 905 Kumquat Place
- 1000 Camellia St
- 2716 Windcrest Ct
- 1440 Ivywood Dr
- 643 Holly Ave
- 1131 Janetwood Dr
- 550 Holly Ave
- 2485 Elderberry Dr Unit 43
- 1920 N H St Unit 235
- 2310 Pebble Beach Trail
- 2320 Pebble Beach Trail
- 2311 Pebble Beach Trail
- 2301 Pebble Beach Trail
- 2321 Pebble Beach Trail
- 2226 Pebble Beach Trail
- 2310 Bayhill Ct
- 2320 Bayhill Ct
- 2224 Pebble Beach Trail
- 2330 Bayhill Ct
- 2340 Bayhill Ct
- 2245 Spyglass Trail W
- 2222 Pebble Beach Trail
- 2300 Bayhill Ct
- 2241 Spyglass Trail W
- 2220 Pebble Beach Trail
- 2301 Bayhill Ct
- 2321 Bayhill Ct
- 2331 Bayhill Ct
- 2218 Pebble Beach Trail
Your Personal Tour Guide
Ask me questions while you tour the home.