Estimated Value: $450,593 - $631,000
2
Beds
1
Bath
900
Sq Ft
$564/Sq Ft
Est. Value
About This Home
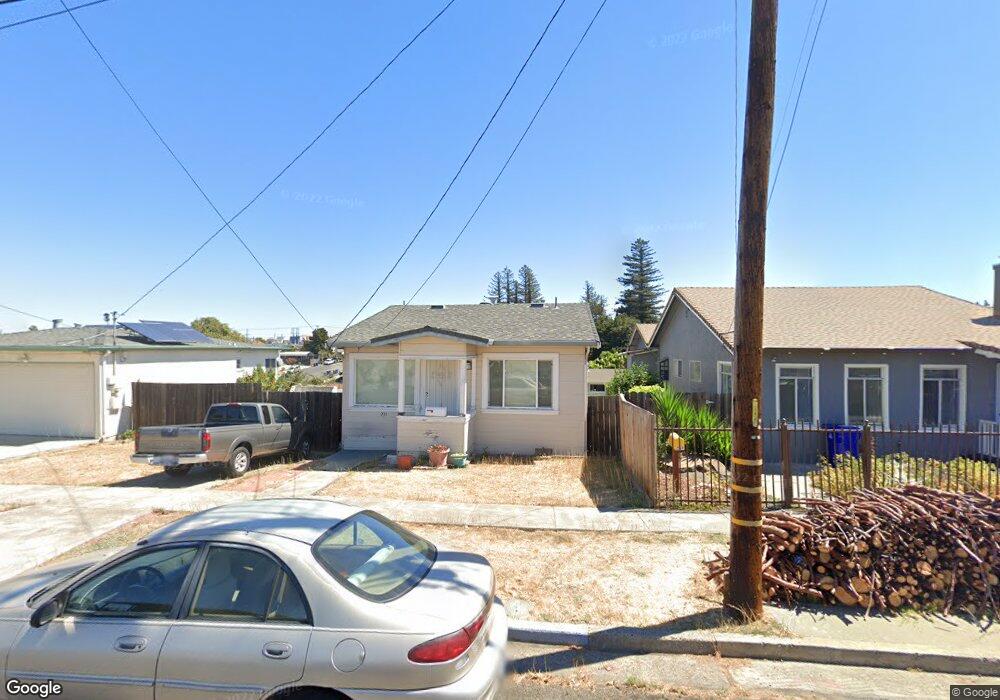
This home is located at 231 Sharon Ave, Rodeo, CA 94572 and is currently estimated at $507,898, approximately $564 per square foot. 231 Sharon Ave is a home located in Contra Costa County with nearby schools including Rodeo Hills Elementary School, Carquinez Middle School, and John Swett High School.
Ownership History
Date
Name
Owned For
Owner Type
Purchase Details
Closed on
Jun 14, 2019
Sold by
Golden Lisa A and Golden Lisa Ann
Bought by
Golden Lisa A
Current Estimated Value
Home Financials for this Owner
Home Financials are based on the most recent Mortgage that was taken out on this home.
Original Mortgage
$135,400
Outstanding Balance
$119,050
Interest Rate
4.1%
Mortgage Type
New Conventional
Estimated Equity
$388,848
Purchase Details
Closed on
Dec 30, 2006
Sold by
Taylor Teresa B
Bought by
Golden Lisa Ann
Purchase Details
Closed on
Apr 6, 2004
Sold by
Taylor Terri B and Golden Lisa Ann
Bought by
Taylor Terri B and Golden Lisa Ann
Purchase Details
Closed on
Apr 16, 1998
Sold by
Esteves and Mary
Bought by
Taylor Terri B and Golden Lisa Ann
Home Financials for this Owner
Home Financials are based on the most recent Mortgage that was taken out on this home.
Original Mortgage
$118,387
Interest Rate
7.15%
Mortgage Type
FHA
Create a Home Valuation Report for This Property
The Home Valuation Report is an in-depth analysis detailing your home's value as well as a comparison with similar homes in the area
Home Values in the Area
Average Home Value in this Area
Purchase History
| Date | Buyer | Sale Price | Title Company |
|---|---|---|---|
| Golden Lisa A | -- | Lawyers Title Company | |
| Golden Lisa Ann | -- | None Available | |
| Taylor Terri B | -- | -- | |
| Taylor Terri B | $120,000 | Fidelity National Title Co |
Source: Public Records
Mortgage History
| Date | Status | Borrower | Loan Amount |
|---|---|---|---|
| Open | Golden Lisa A | $135,400 | |
| Previous Owner | Taylor Terri B | $118,387 |
Source: Public Records
Tax History
| Year | Tax Paid | Tax Assessment Tax Assessment Total Assessment is a certain percentage of the fair market value that is determined by local assessors to be the total taxable value of land and additions on the property. | Land | Improvement |
|---|---|---|---|---|
| 2025 | $3,943 | $191,421 | $99,225 | $92,196 |
| 2024 | $3,721 | $187,669 | $97,280 | $90,389 |
| 2023 | $3,721 | $183,990 | $95,373 | $88,617 |
| 2022 | $3,583 | $180,383 | $93,503 | $86,880 |
| 2021 | $3,524 | $176,847 | $91,670 | $85,177 |
| 2019 | $3,438 | $171,603 | $88,952 | $82,651 |
| 2018 | $3,358 | $168,239 | $87,208 | $81,031 |
| 2017 | $3,298 | $164,942 | $85,499 | $79,443 |
| 2016 | $3,021 | $161,709 | $83,823 | $77,886 |
| 2015 | $2,998 | $159,281 | $82,564 | $76,717 |
| 2014 | $2,812 | $144,500 | $74,902 | $69,598 |
Source: Public Records
Map
Nearby Homes
- 338 Garretson Ave
- 229 Lake Ave
- 511 Third St
- 343 Rodeo Ave
- 205 Pacific Ave Unit 213
- 139 Rodeo Ave
- 715 Mariposa Ave
- 729 1st St
- 106 White Cap Cove
- 11 Fallen Leaf Ct
- 1012 Salt Spray Terrace
- 1334 7th St
- 836 Hawthorne Dr
- 900 Seascape Cir
- 1101 Chelsea
- 834 Coral Ridge Cir
- 801 Dover
- 802 Dover
- 797 Coral Ridge Cir
- 3198 S Front St
Your Personal Tour Guide
Ask me questions while you tour the home.